Optical property with optimal basis
In this tutorial we will go through the details of optical property calculation with optimal basis function. We will use Quantum ESPRESSO SIMPLE.X program to calculate dielectric function of silicon. Please refer to the original paper: SIMPLE code: Optical properties with optimal basis functions, Prandini, G., Galante, M., Marzari, N., & Umari, P., Computer Physics Communications, 240, 106 (2019) for the detailed physics behind this calculation.
Below we will replicate the example 5 from Quantum ESPRESSO GWW directory. Alternatively, input and reference output files are available in our CLI-job-examples repository.
1. Create workflow
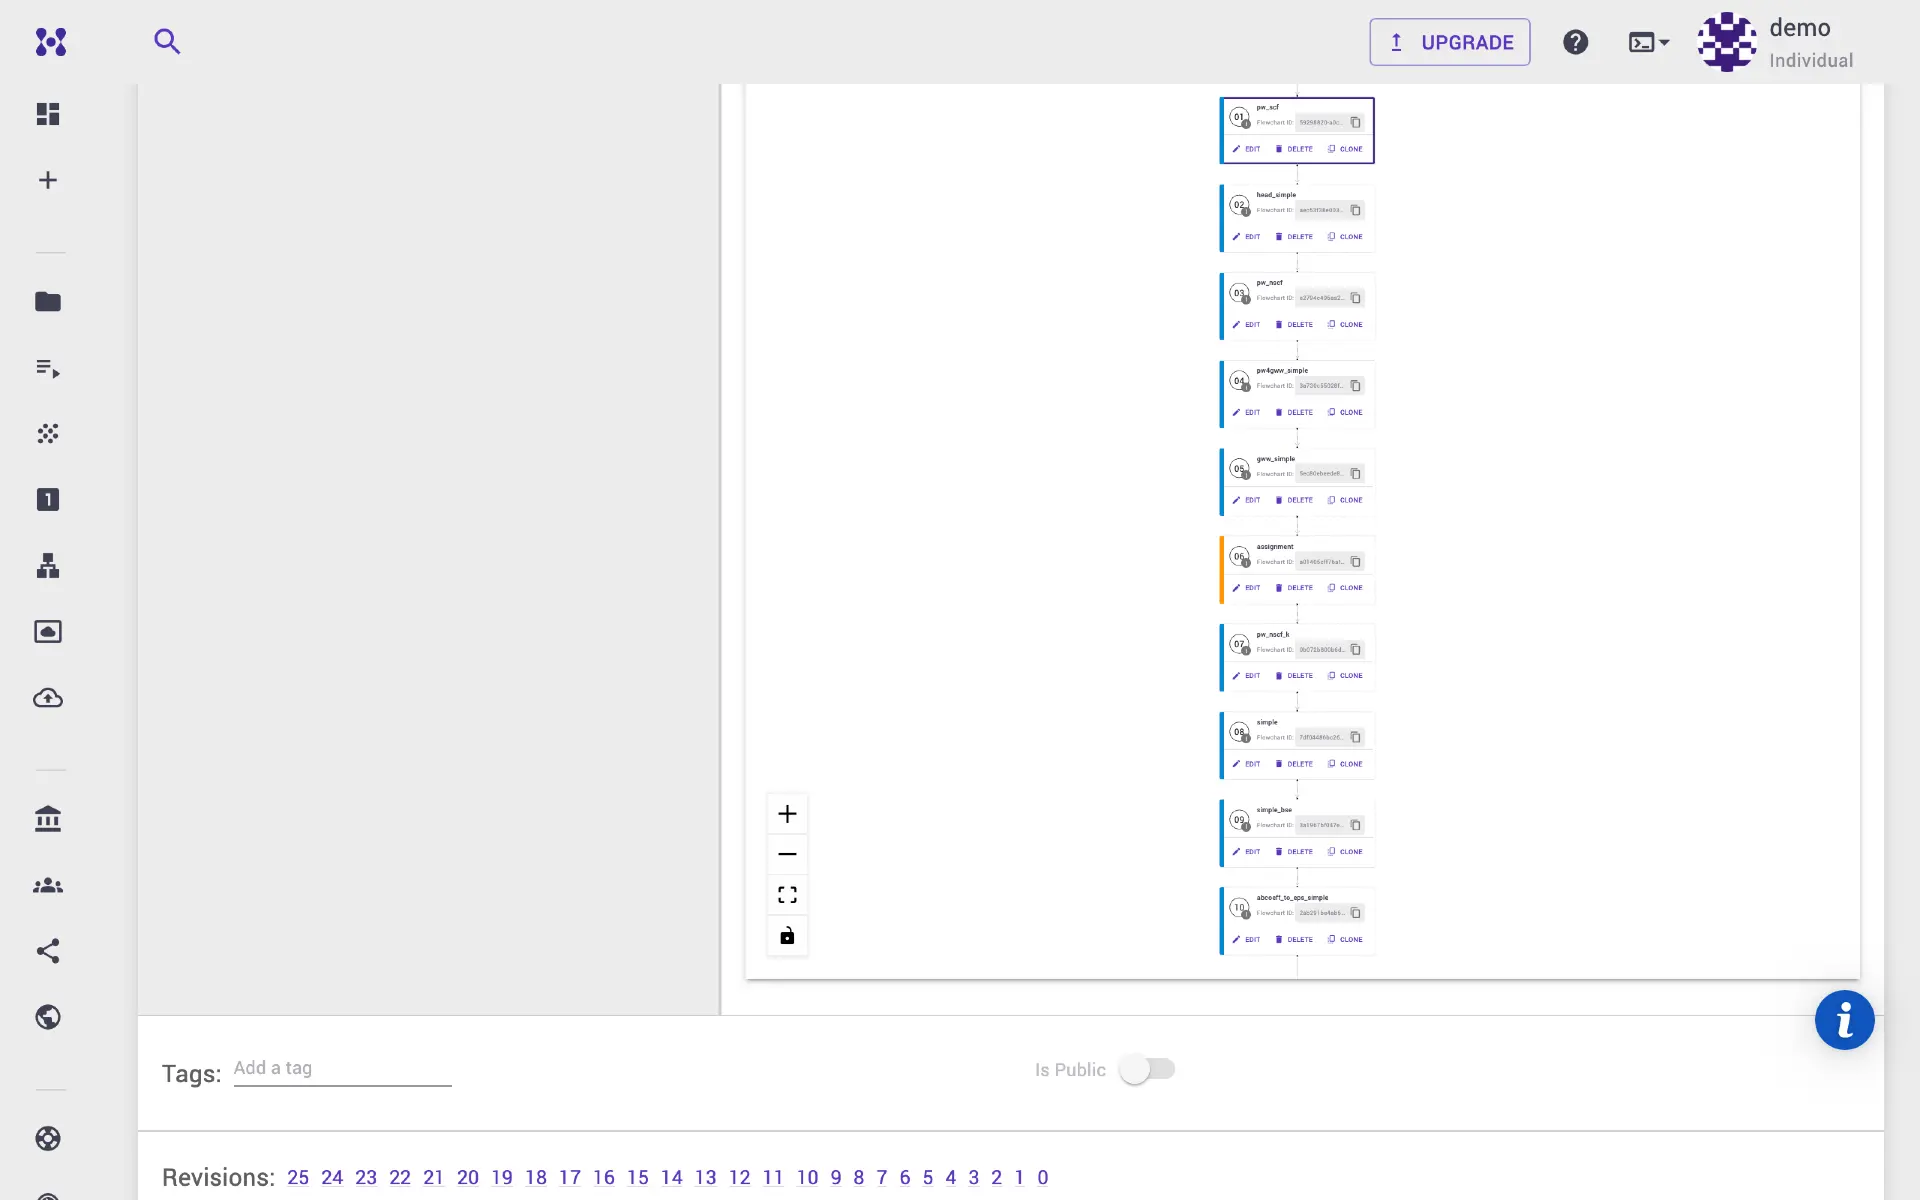
Dielectric constant calculation workflow using SIMPLE method involves following steps.
1.1 PW SCF calculation
First step is to perform self consistent field calculation. Navigate to workflows page in our web platform, and click create new workflow. Quantum ESPRESSO version and build can be changed by expanding the details pane, and selecting the options from respective drop-down menu.
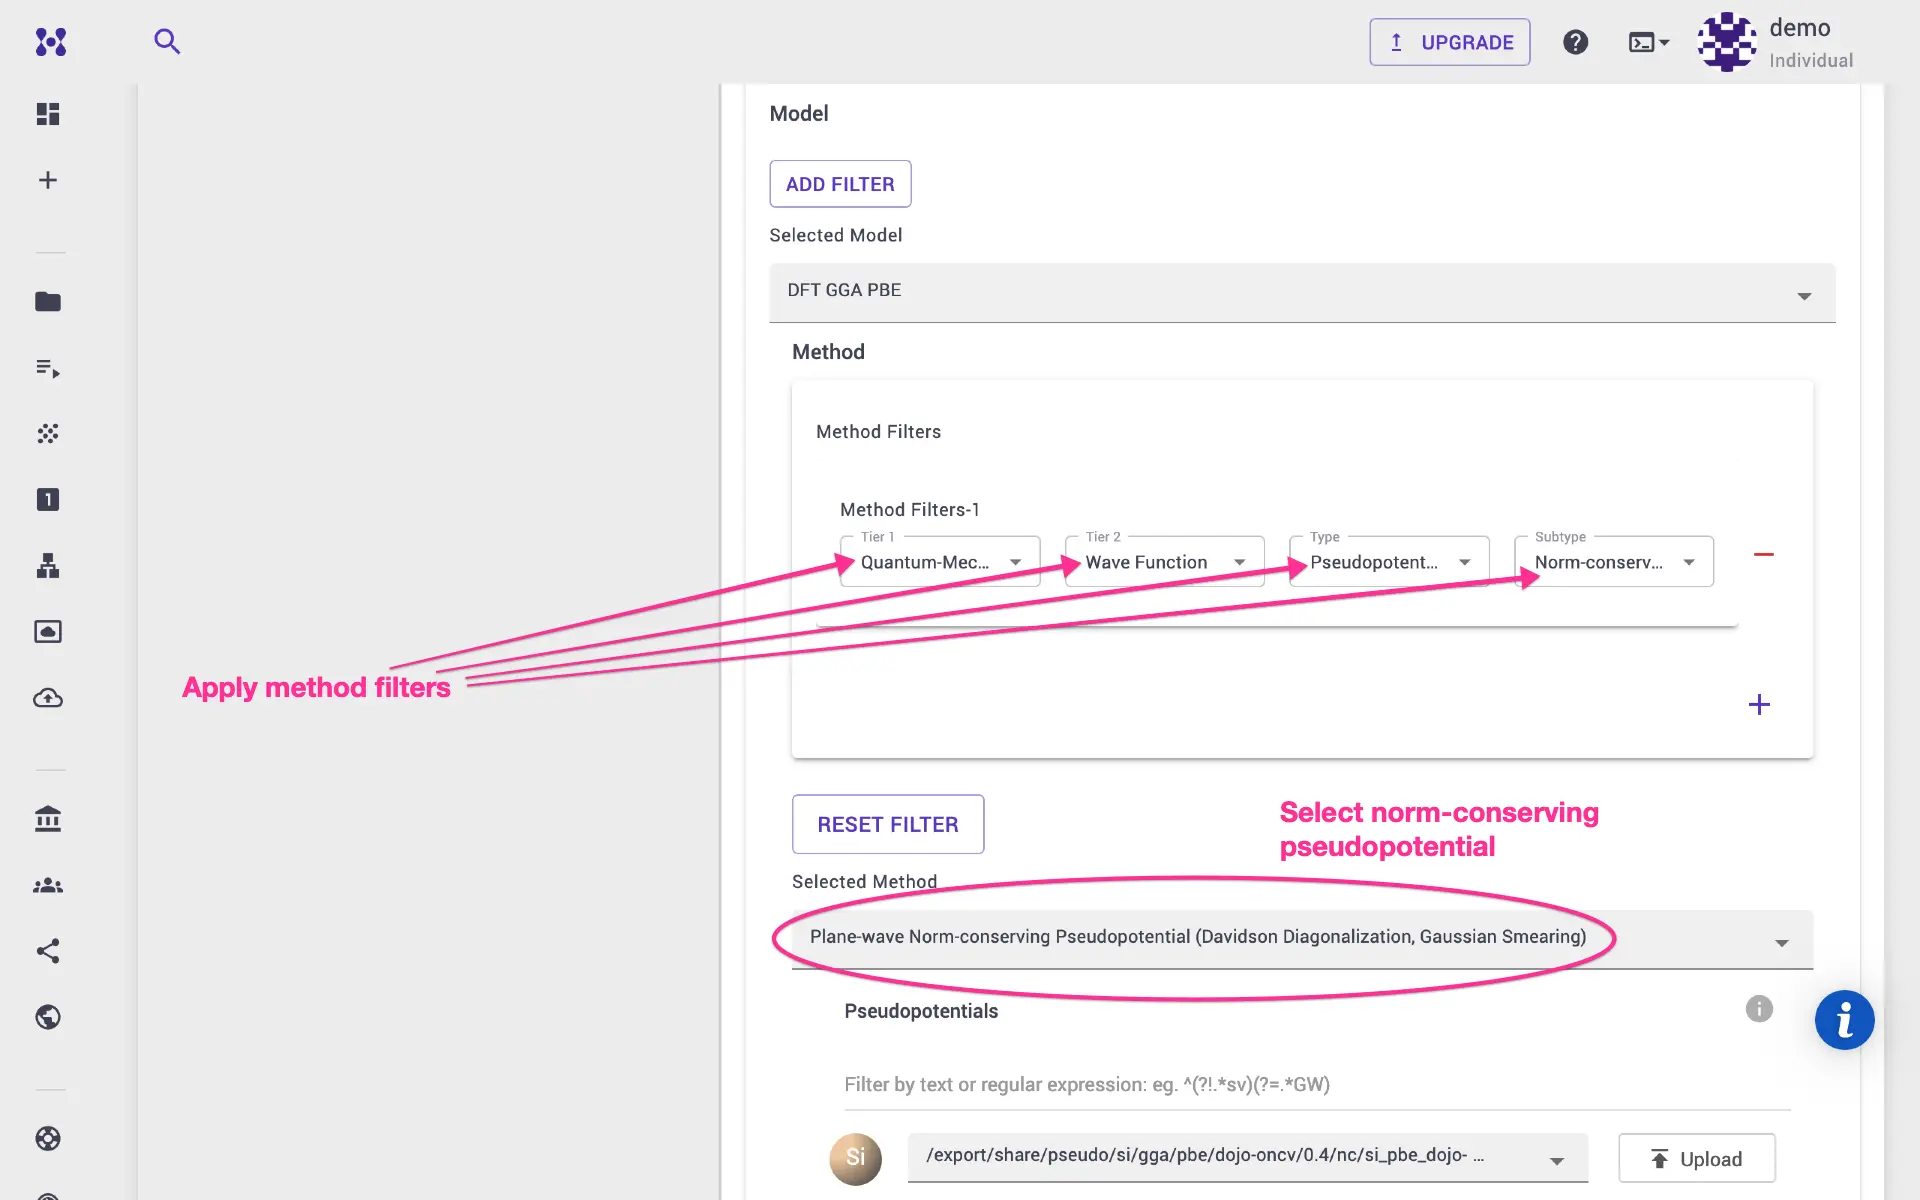
Currently, SIMPLE code only supports norm-conserving pseudopotential. Please choose norm-conserving pseudopotential after applying appropriate method filters.
We will provide, lattice parameters via ibrav and celldm instead of
CELL_PARAMETERS card. Click edit on the pw_scf unit, and directly modify
desired parameters on the template. We can set energy and charge density cutoffs
as well as k-gird parameters on the Important Settings tab.
1.2 HEAD calculation
Add next unit (execution unit) and select head.x executable, adjust
parameters on the head template as necessary.
1.3 NSCF calculation (Gamma-only)
Next step is to perform a non-self consistent field calculation for \(\Gamma\)
point only. Add an execution unit, click edit unit, select pw_nscf flavor.
Edit the ibrav and other parameters as we did in the PW SCF step. Note that we
have set nbnd as well. Finally, set the k-grid only for gamma point
calculation.
1.4 pw4gww.x
We need to prepare input files for GWW calculation. Similarly, add a unit with pw4gww.x executable. Take note of various input parameters, and modify on the template as necessary.
1.5 GWW calculation
Add unit with gww.x executable, and adjust various input parameters in the template via edit unit.
1.6 NSCF calculation with k-grid
Next we need to perform non-self consistent field calculation for finite k-grid.
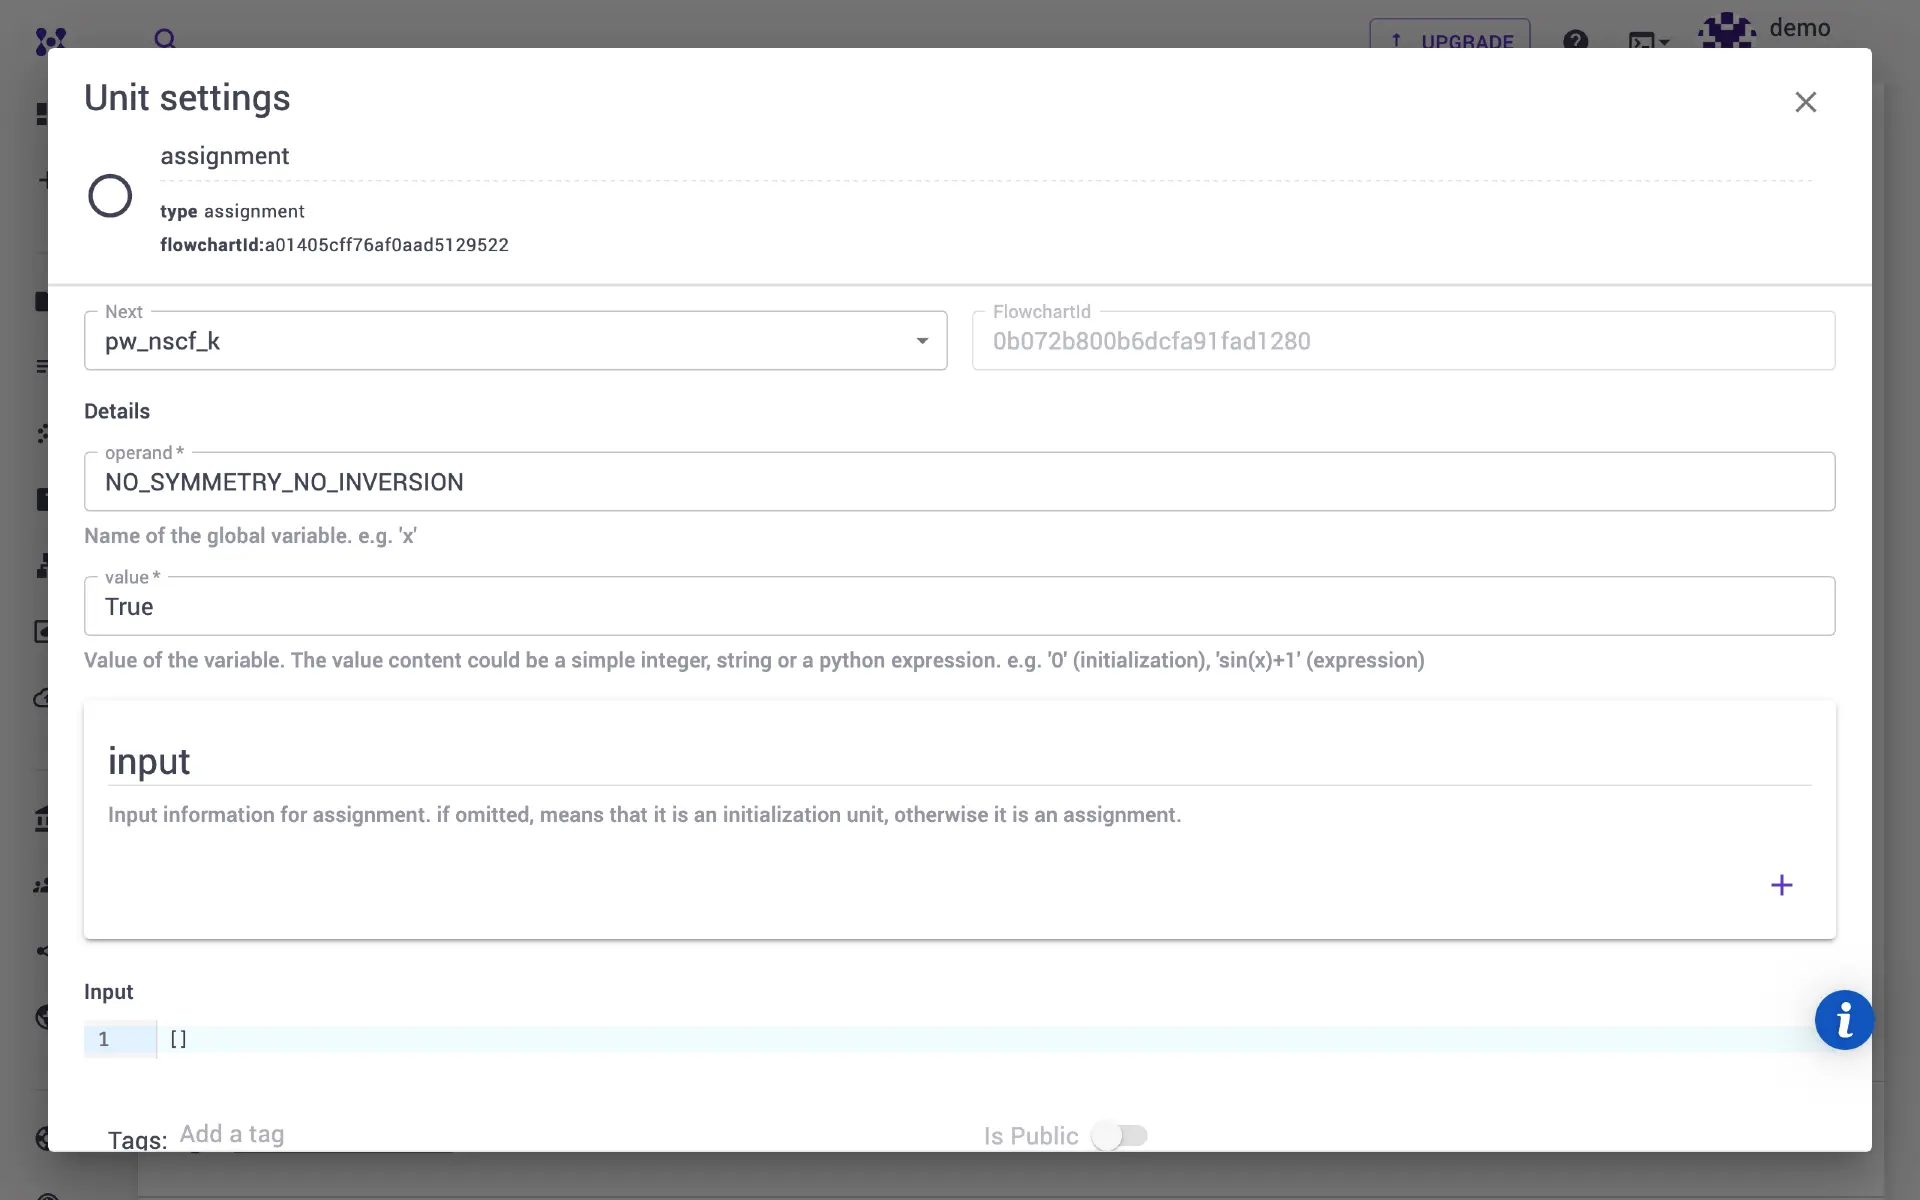
We also need to set no symmetry and no inversion for our nscf runs so that
Quantum ESPRESSO does not reduce the number of k-points based on symmetry. In
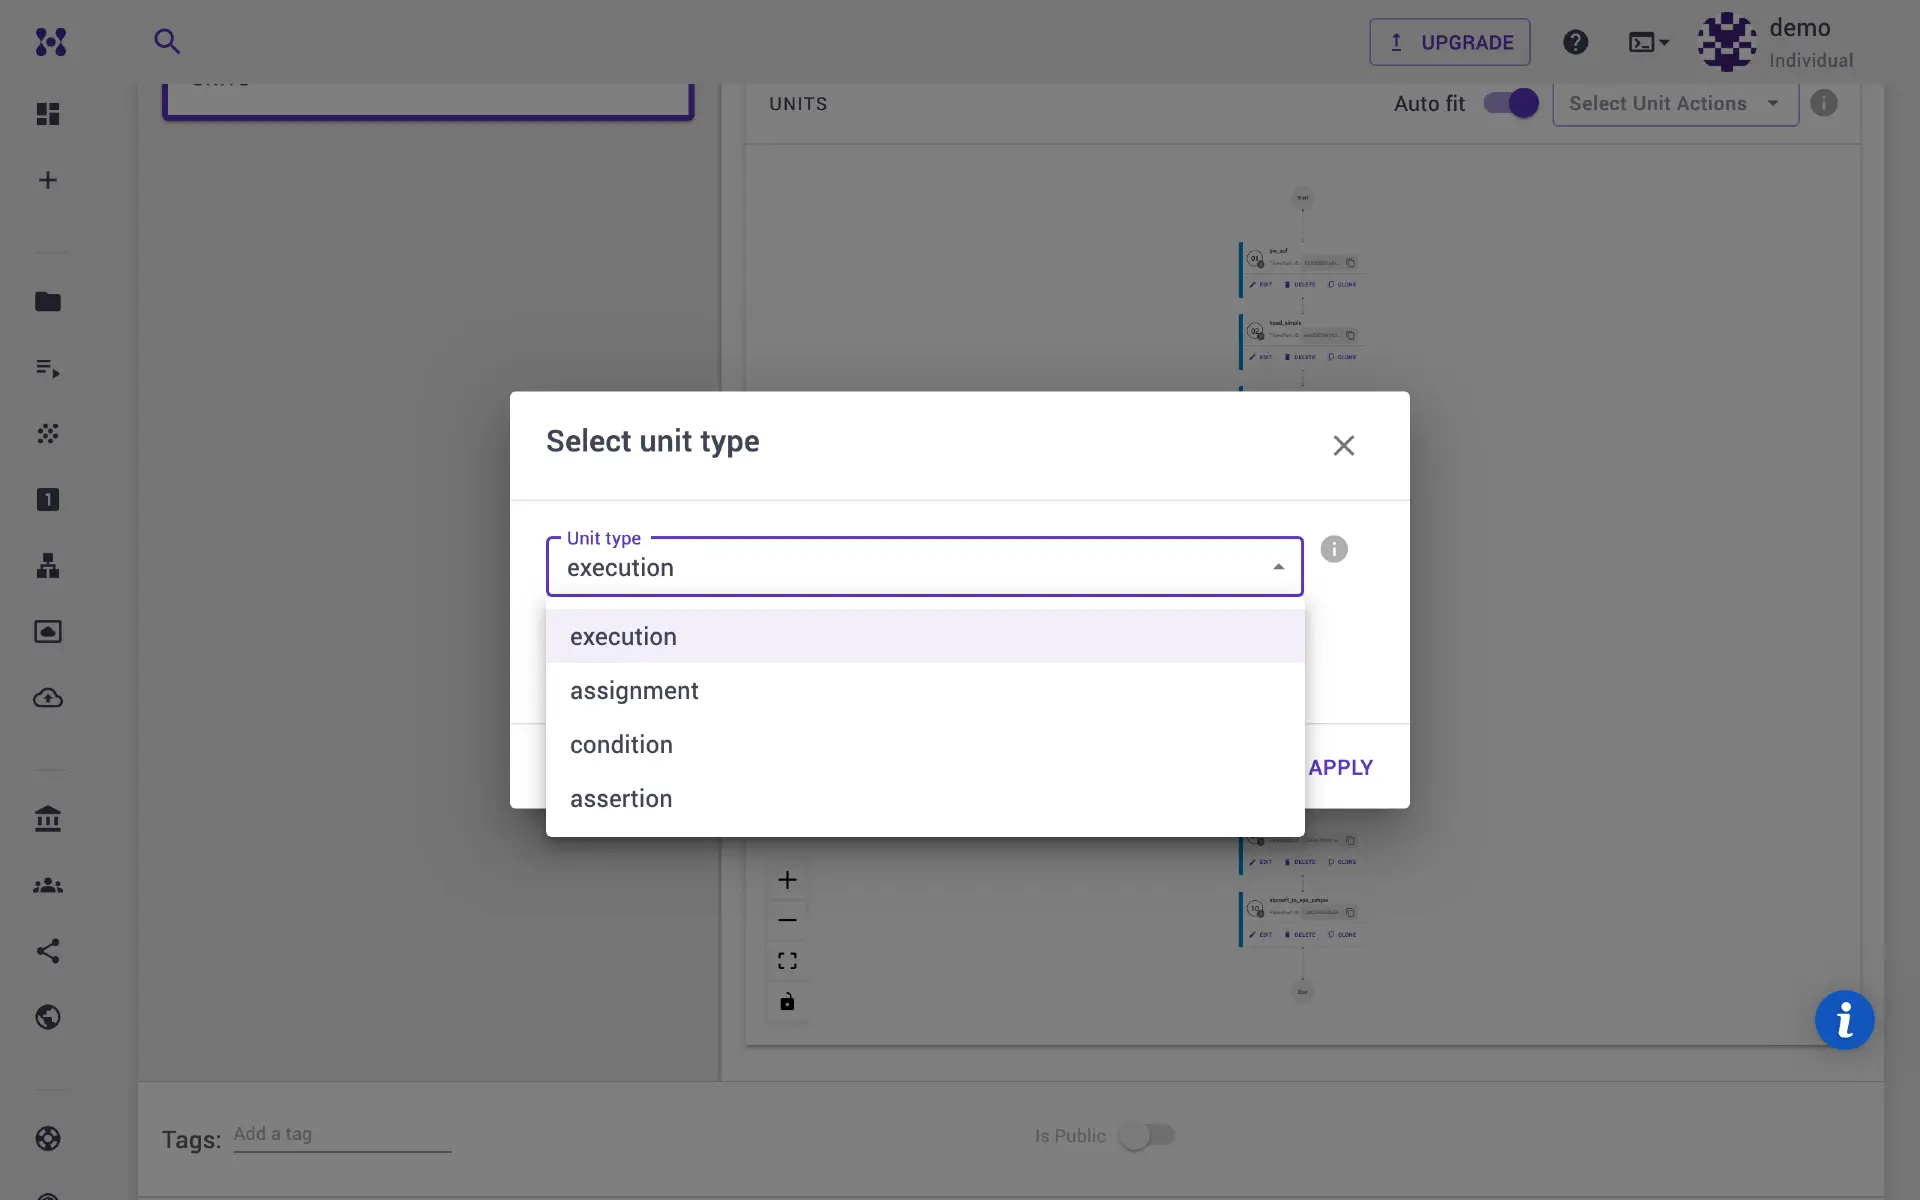
our platform, it can be done via an assignment unit. Click and add unit, and
select assignment unit from the drop-down. Later assign a variable:
NO_SYMMETRY_NO_INVERSION and set the value to true.
Add an execution unit for nscf calculation. Here we update the number of bands
(nbnd) to 40. The k-grid is set to 2×2×2 via the Important Settings tab.
Remember to give the unit a unique name, as we already have a unit with name
pw_nscf, otherwise some of the generated file names may create conflicts.
1.7 SIMPLE calculation
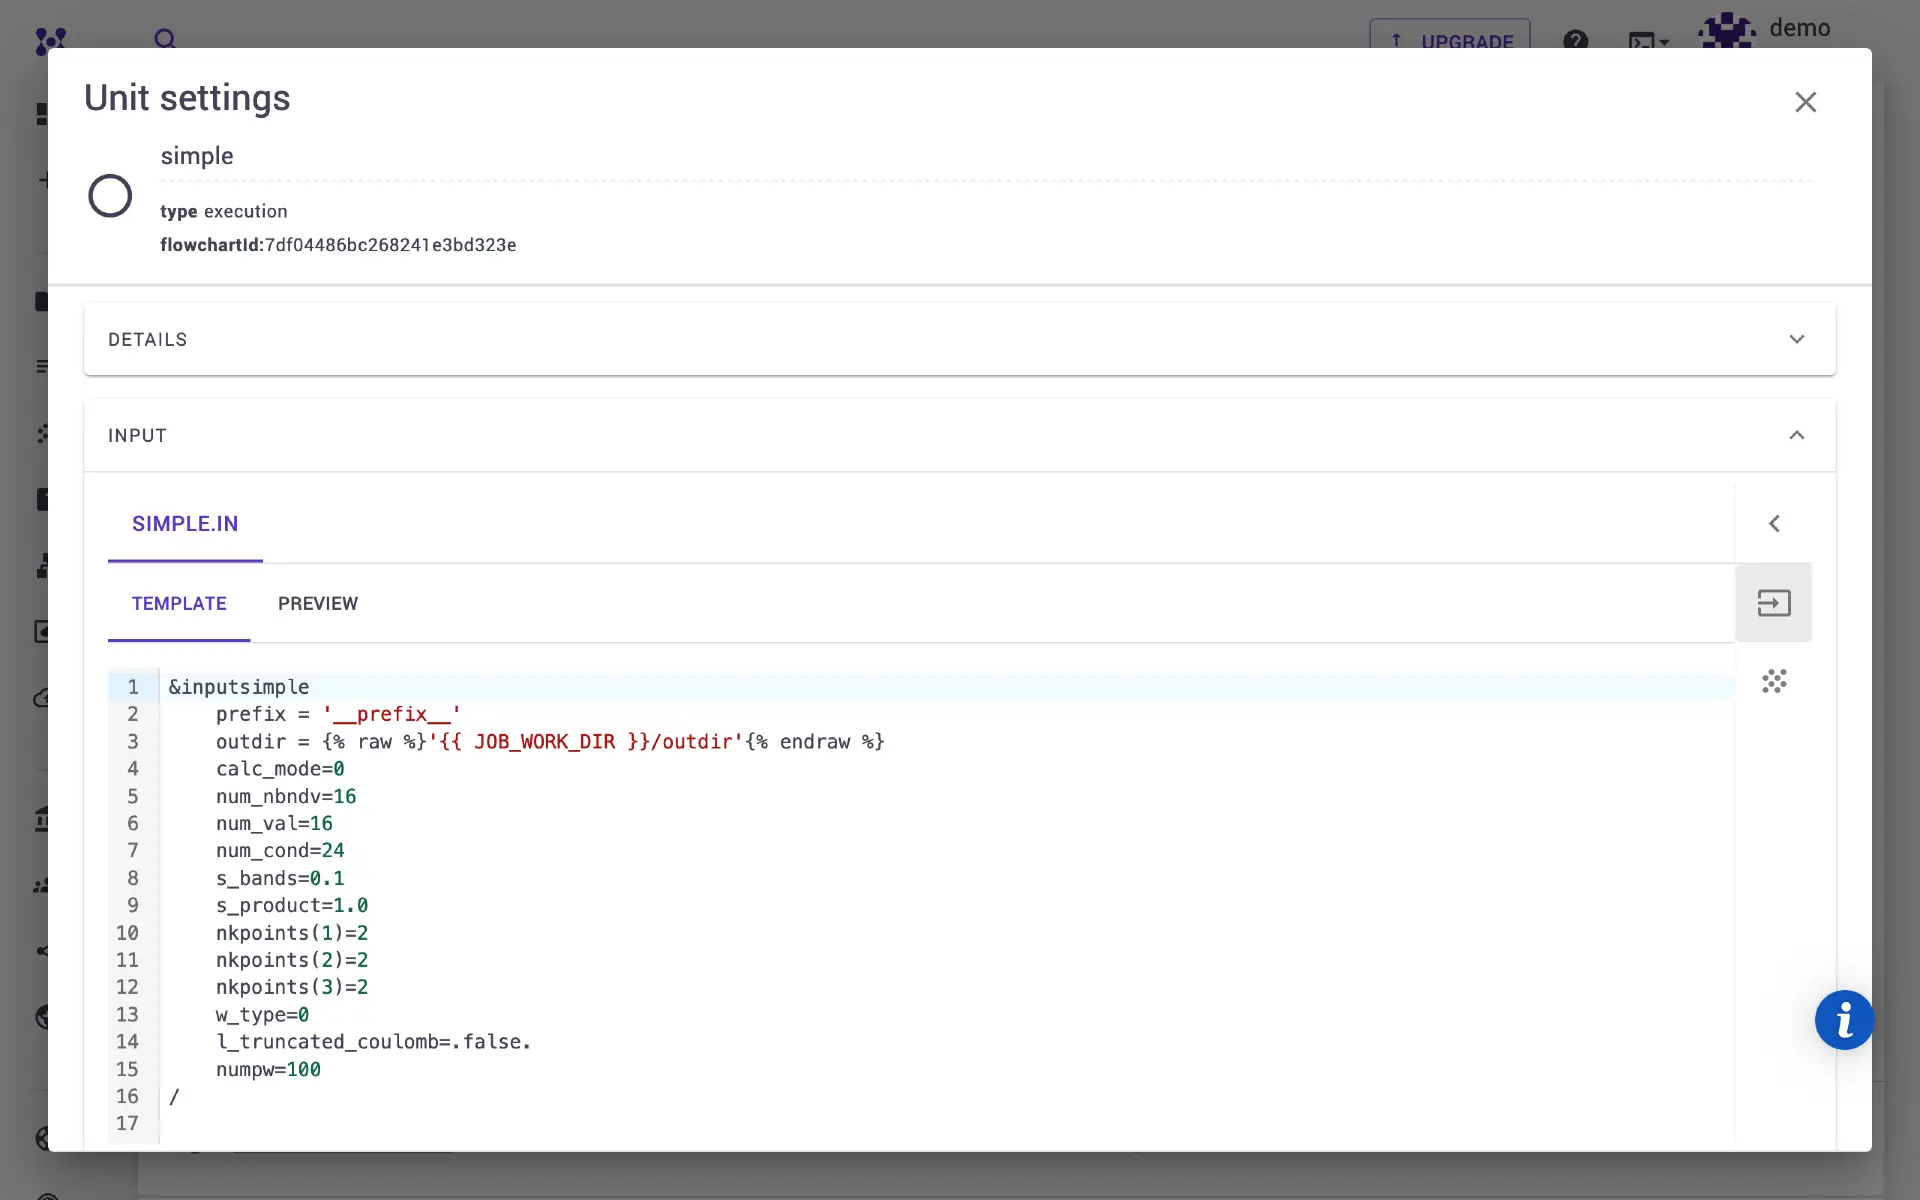
Now, we are ready the calculate the optimal basis set using simple.x. Here,
we will choose the calc_mode=0 for BSE method. One can set calc_mode=1 for
Independent Particle (IP) method. Specify number of valence band to 16, and
conduction band to 24.
1.8 SIMPLE BSE calculation
Add next unit for the dielectric function calculation using simple_bse.x program. Alternatively, user can select simple_ip.x method instead.
1.9 Post processing
The the above step calculates the \(\alpha\) and \(\beta\) coefficients of Haydock series, which can be transformed into dielectric constant using abcoeff_to_eps.x post processing utility.
2. Run Job
Once workflow is ready, navigate to jobs page and create new job. Select the workflow, adjust compute parameters as desired. Submit the job for execution. Once the job is completed, navigate to the Files tab. Here the epsilon output files can be found. User may launch a Jupyter notebook session in our platform to quickly plot epsilon or download the output files and use any plotting program for visualization.
3. Step by step screenshare video
In the below tutorial, we go through the whole process.