Create an interface between two materials in JupyterLite notebook
This tutorial explains how to create an interface between two materials in Materials Designer employing ZSL algorithm. Example is given for creating an interface between Graphene and Ni(111).
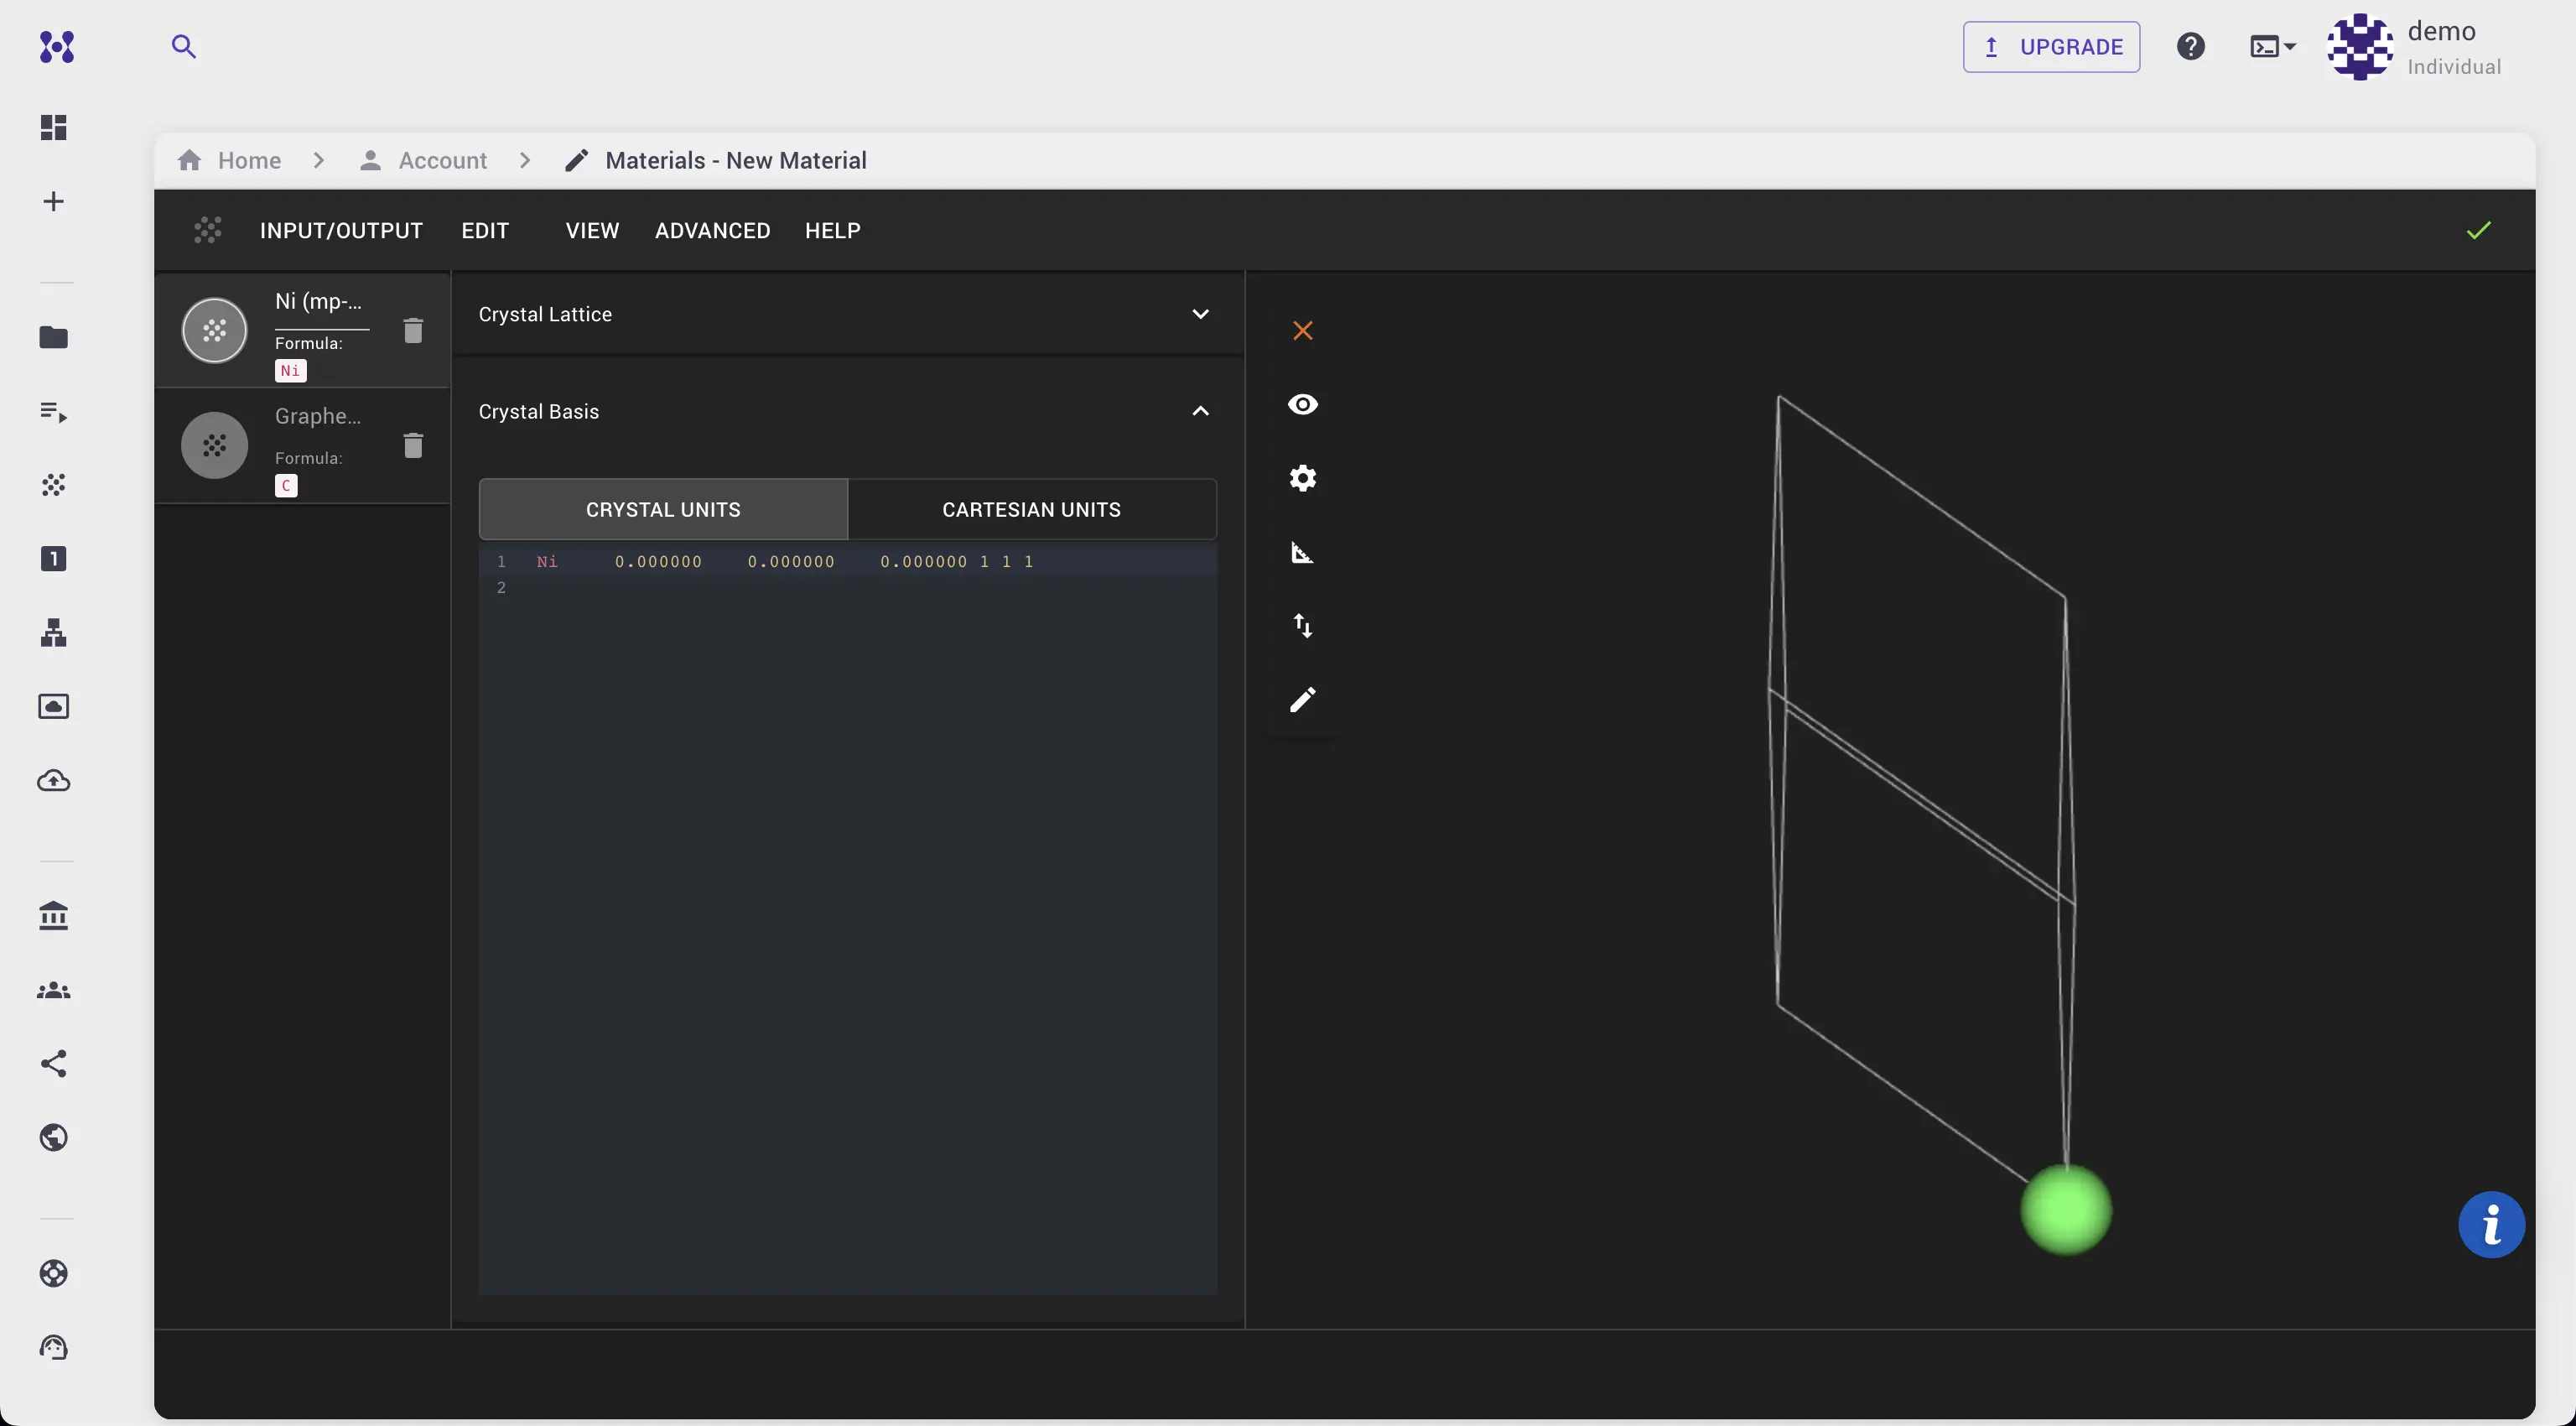
Step 0: Open Materials Designer
We start with opening an instance of the Materials Designer Interface for creating and designing new Materials structures on our platform.
Step 1: Import Materials
In order to use Graphene and Ni, the user should first import sample crystalline structures of the two respective materials into the current Materials Designer session, from the account-owned collection of materials.
Another option is to use materials from a Standard Materials Dataset via Import from Standata.
After importing, Graphene and Ni should be available in the materials list.
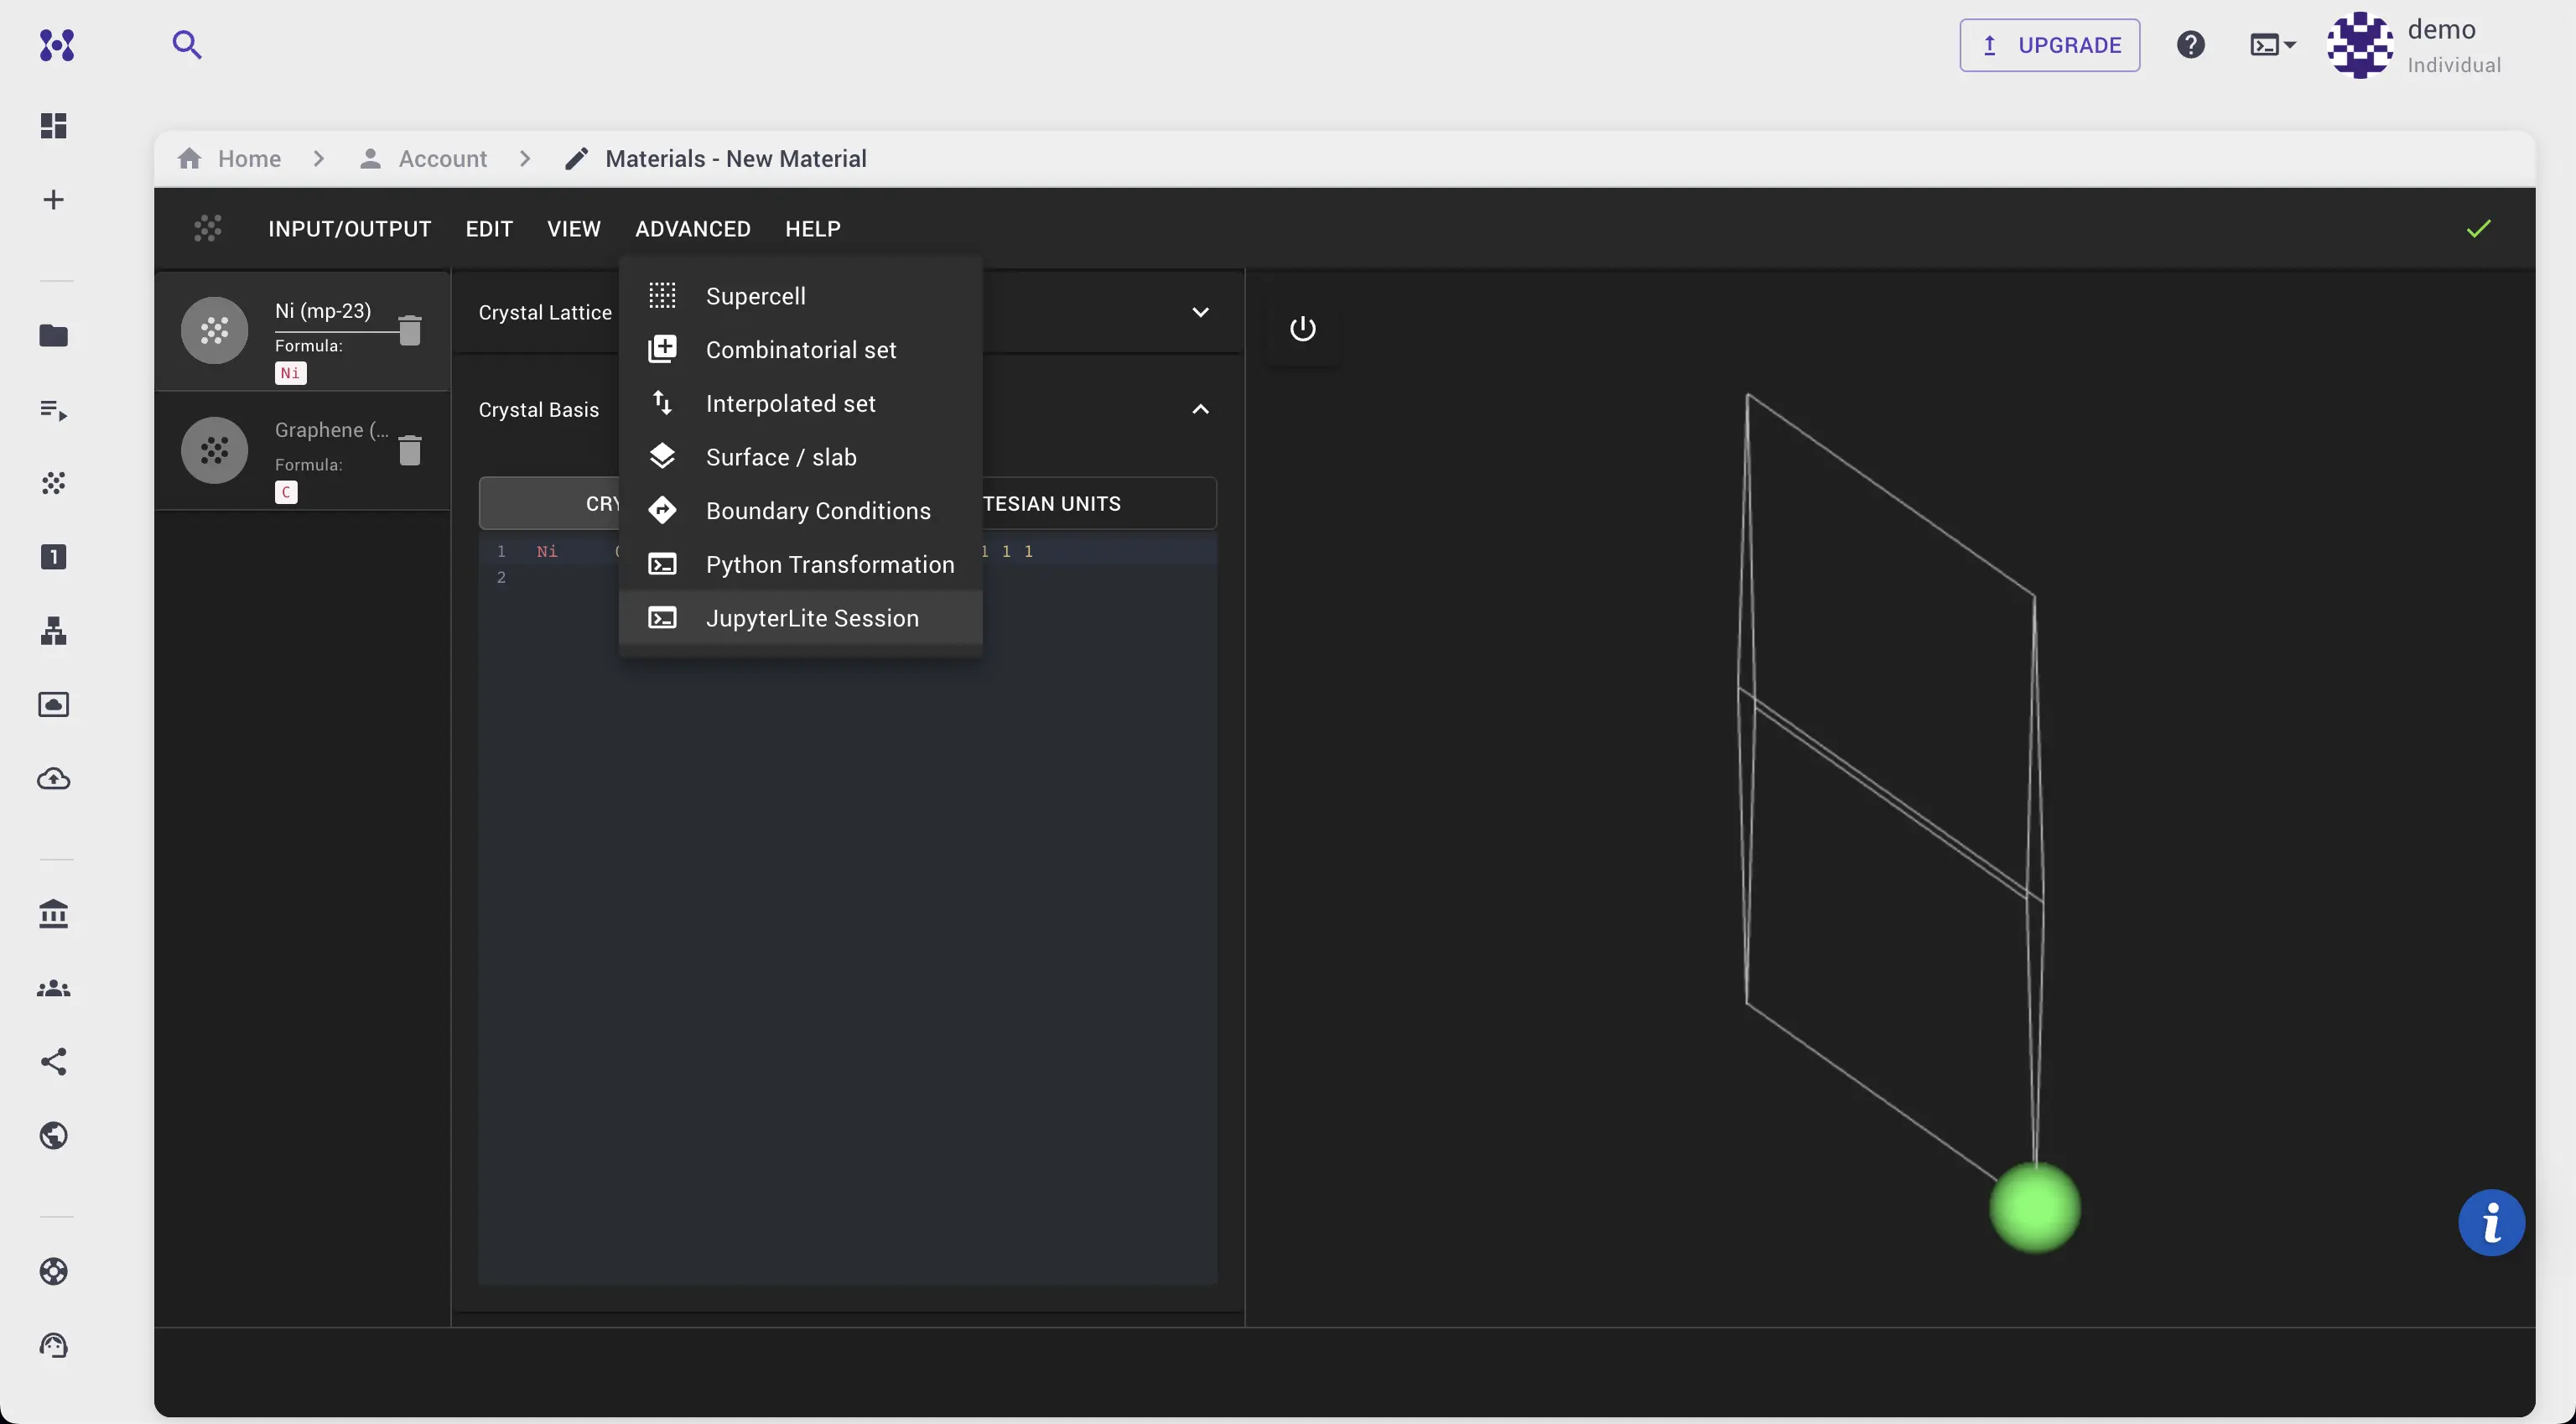
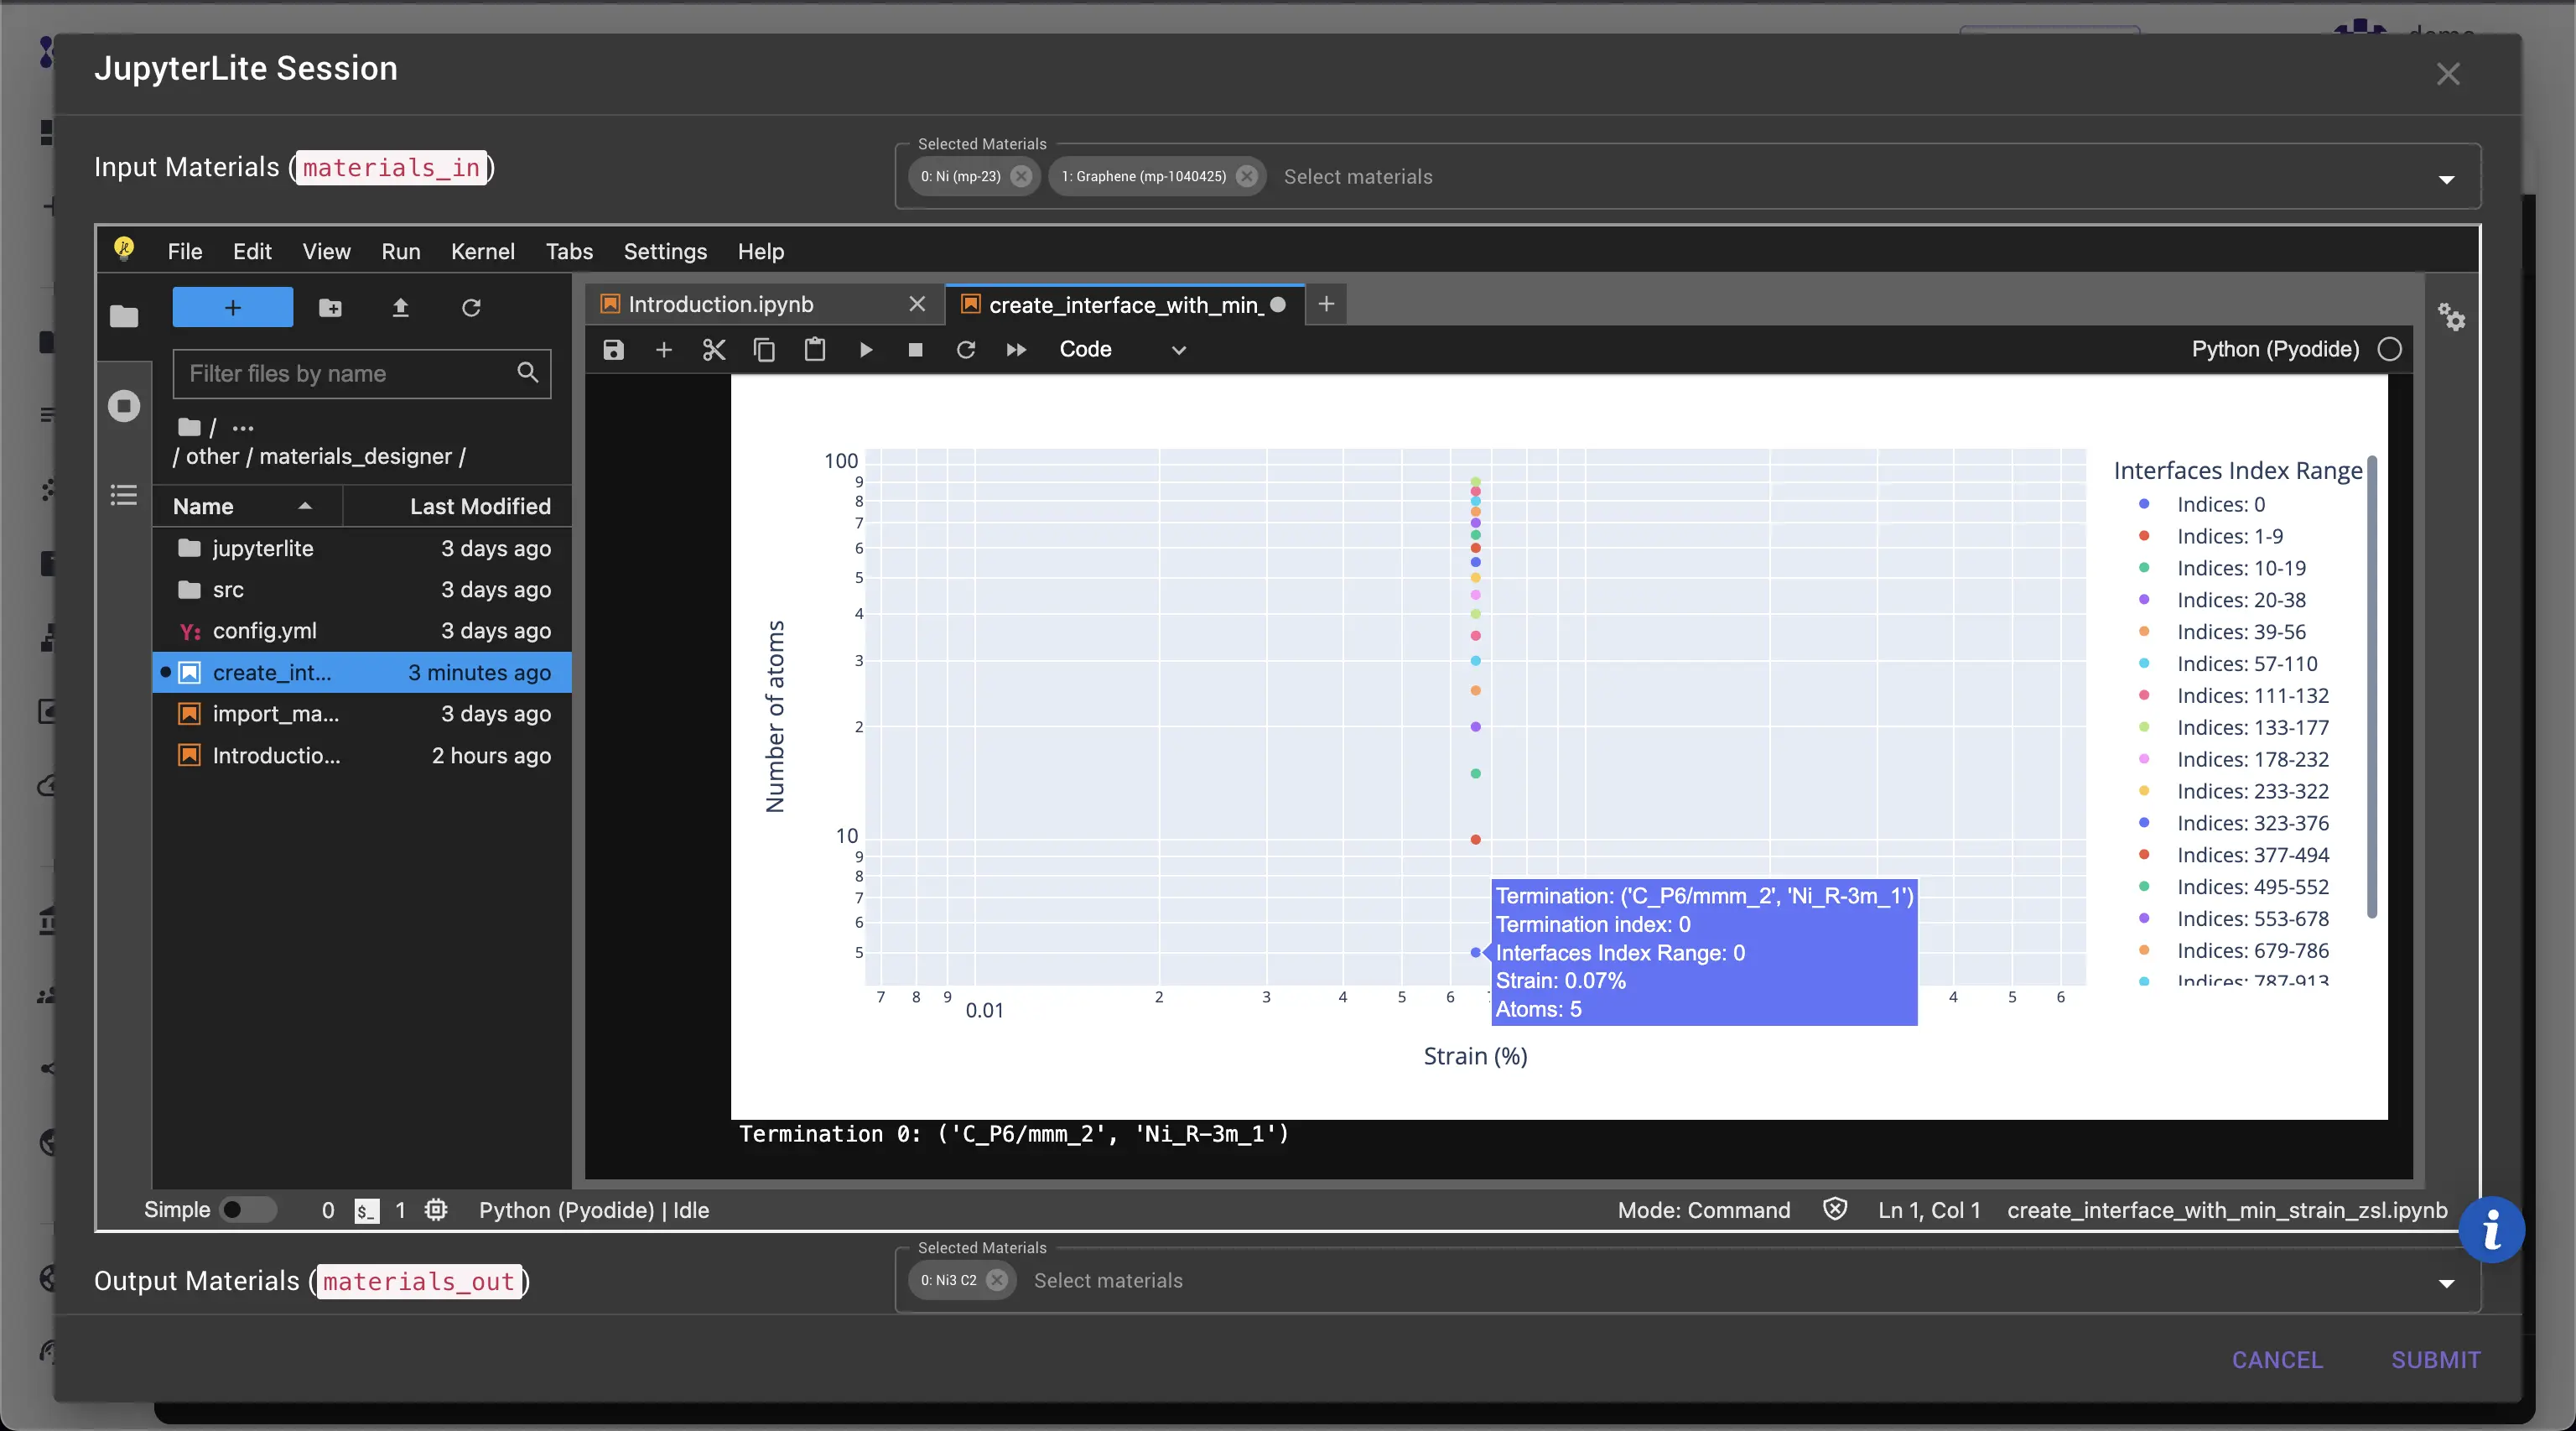
Step 2: Use JupyterLite Session Dialog
Navigate to Advanced > JupyterLite Session from the main interface.
- In the Introduction notebook find the link to the example under
Examples>1. Builders / Transformations>1.1. Interface creation with Zur and McGill Superlattice algorithm

- The link will open the example notebook in a new tab.
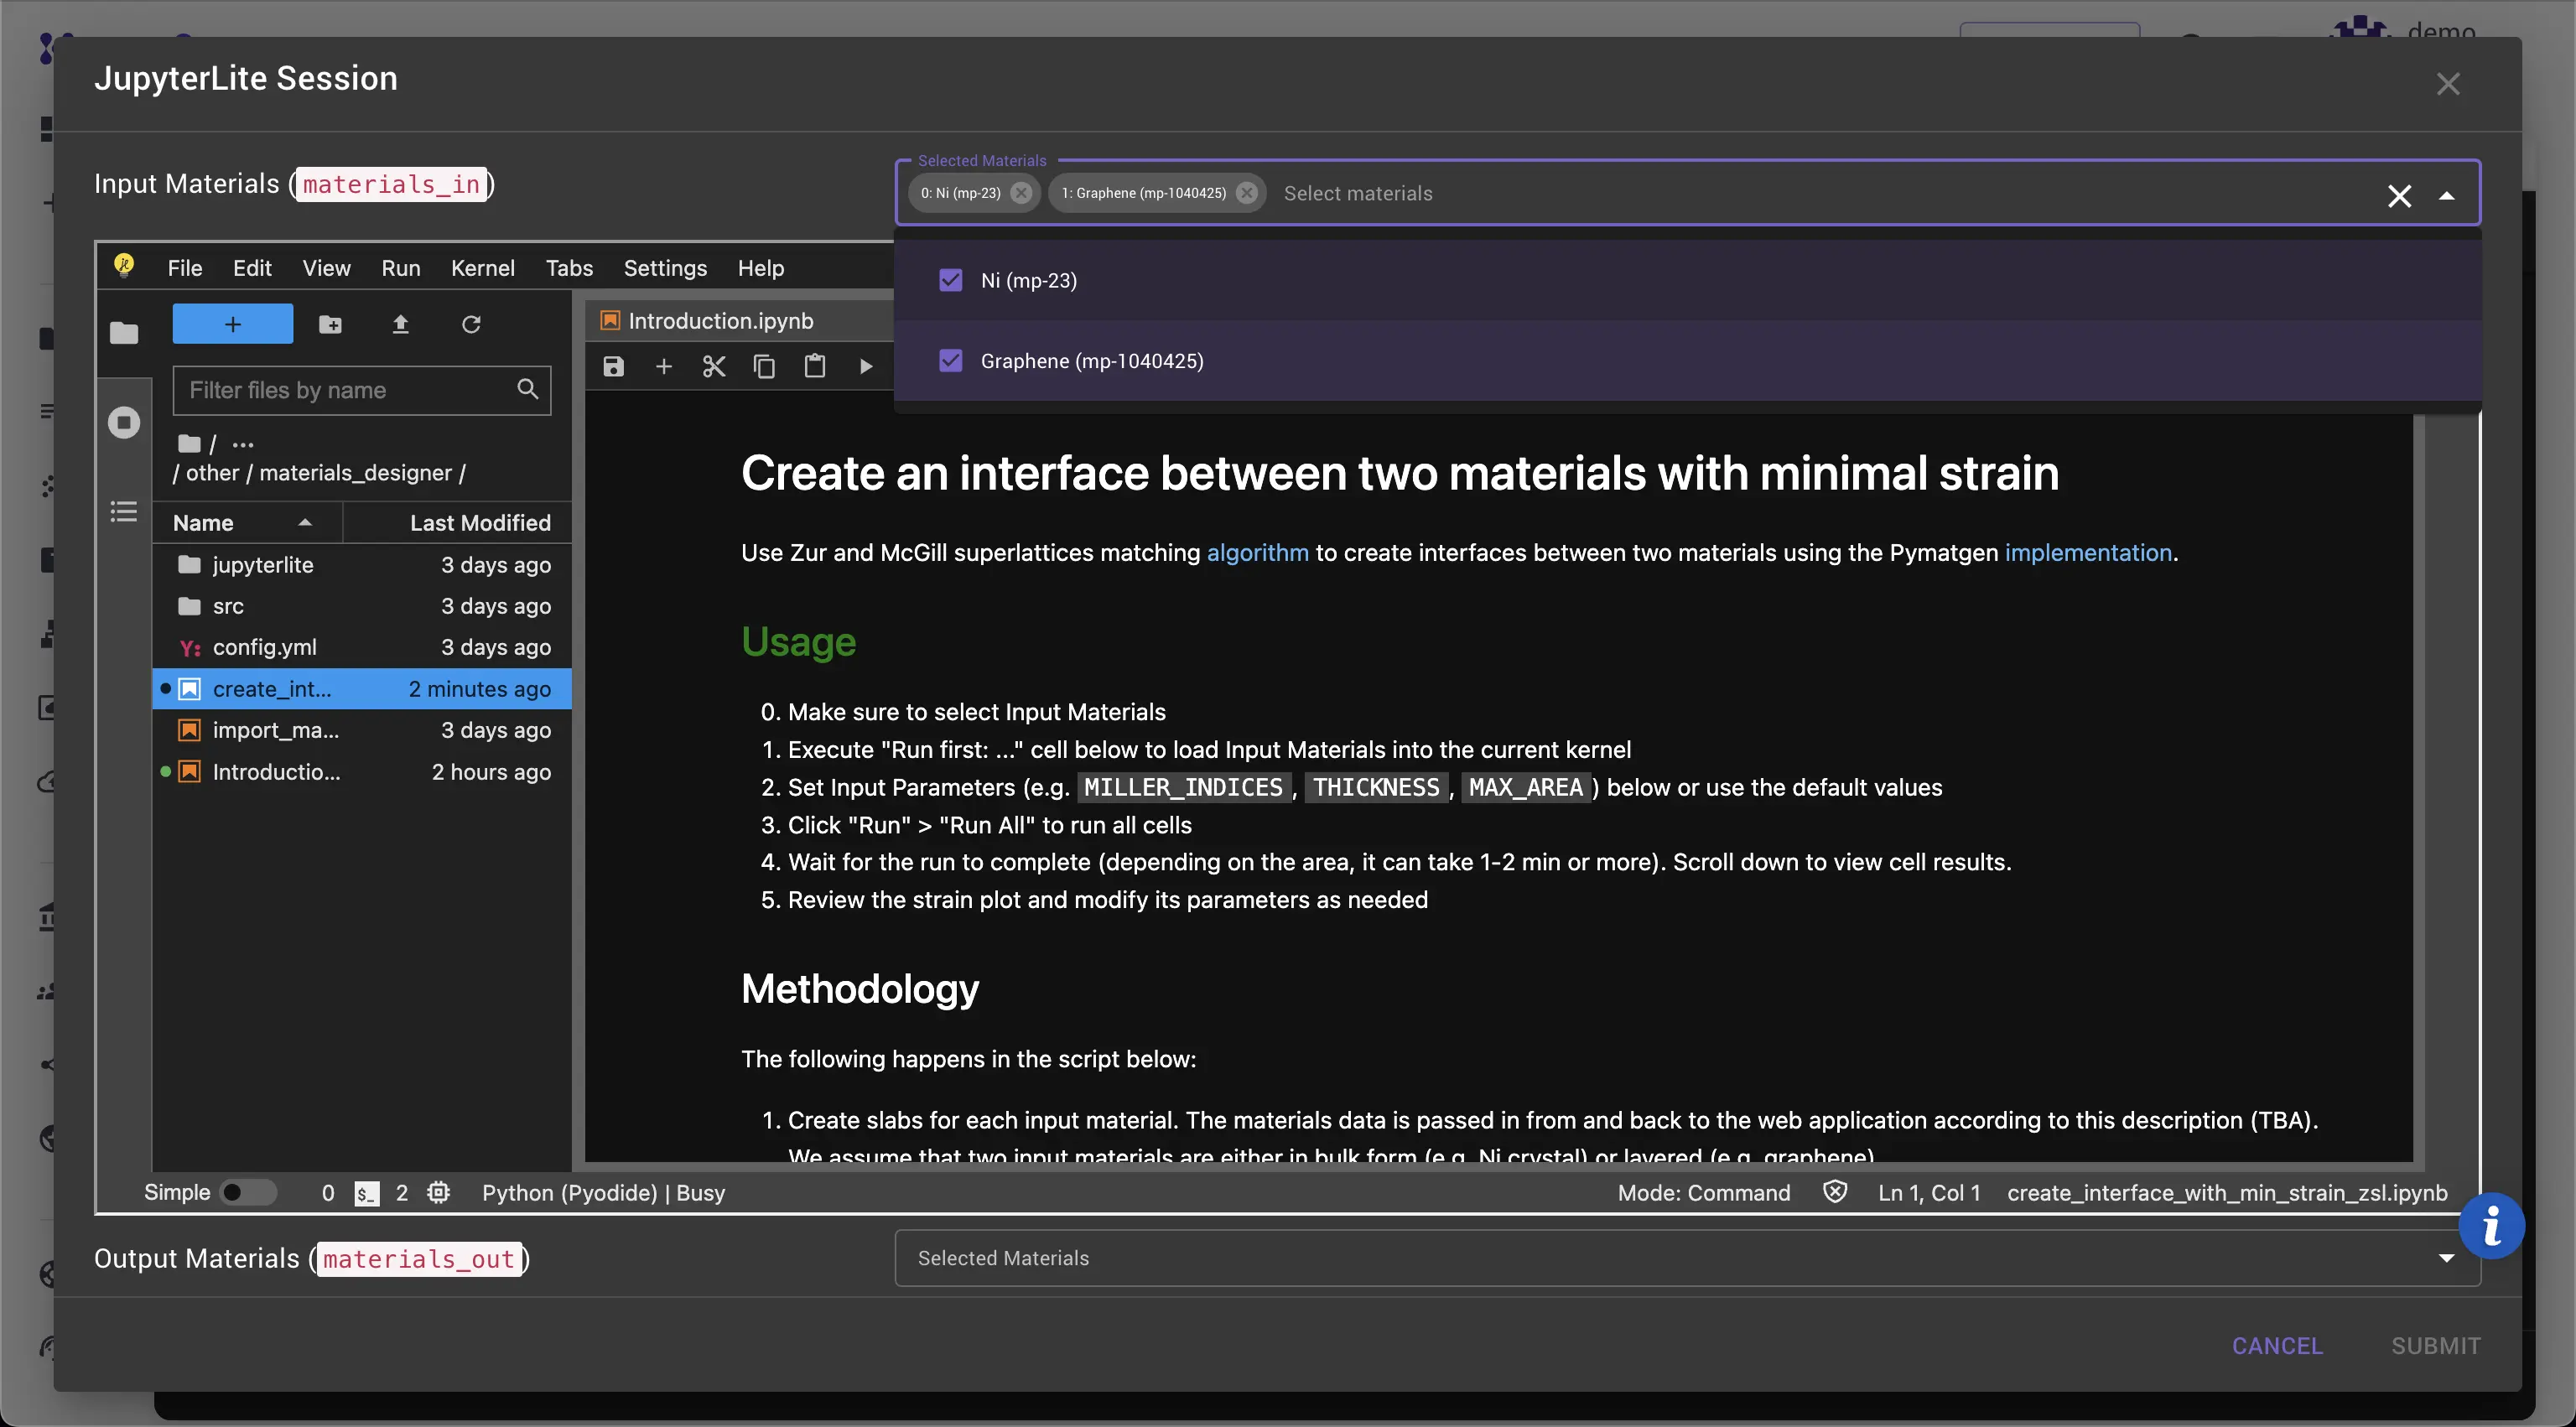
Step 3: Run the Example
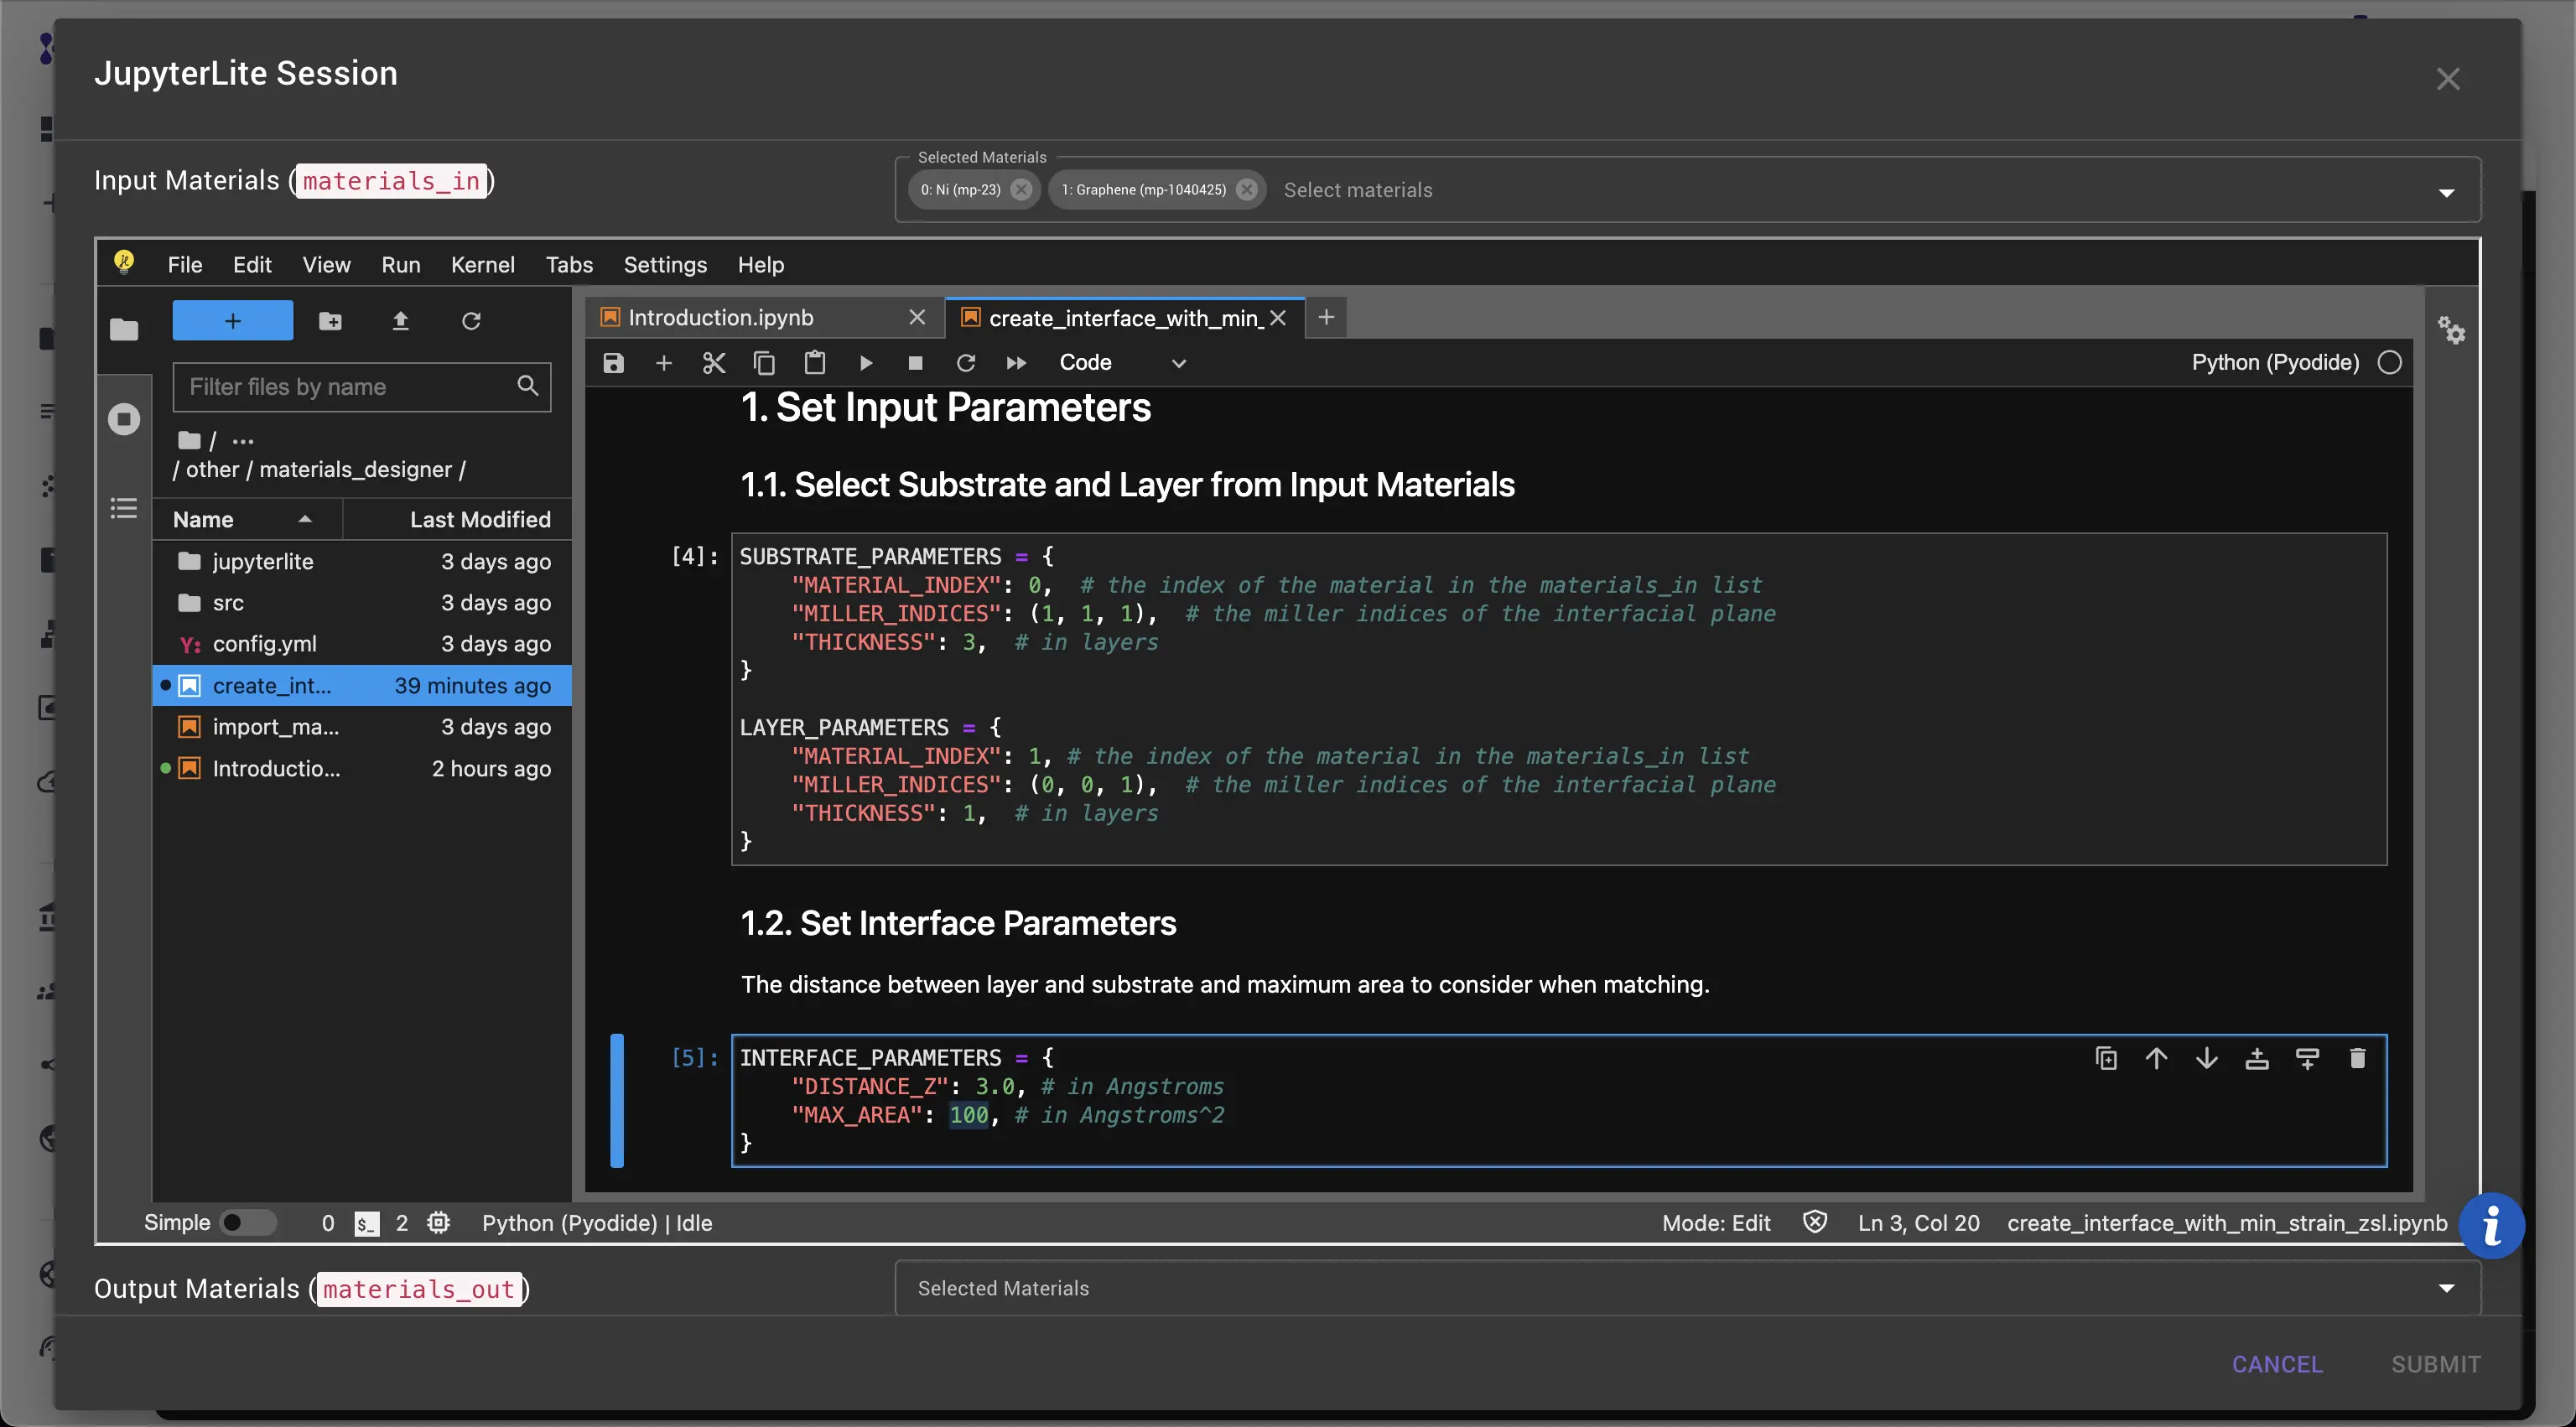
- Select Input Materials from the dropdown list to make them available in the notebook. (Ni and Graphene in this case)
- Run the cell marked as
Run firstto load the input materials into the notebook. (Loading is done asynchronously from outside JupyterLite kernel, so it may take a few seconds for the kernel to register)
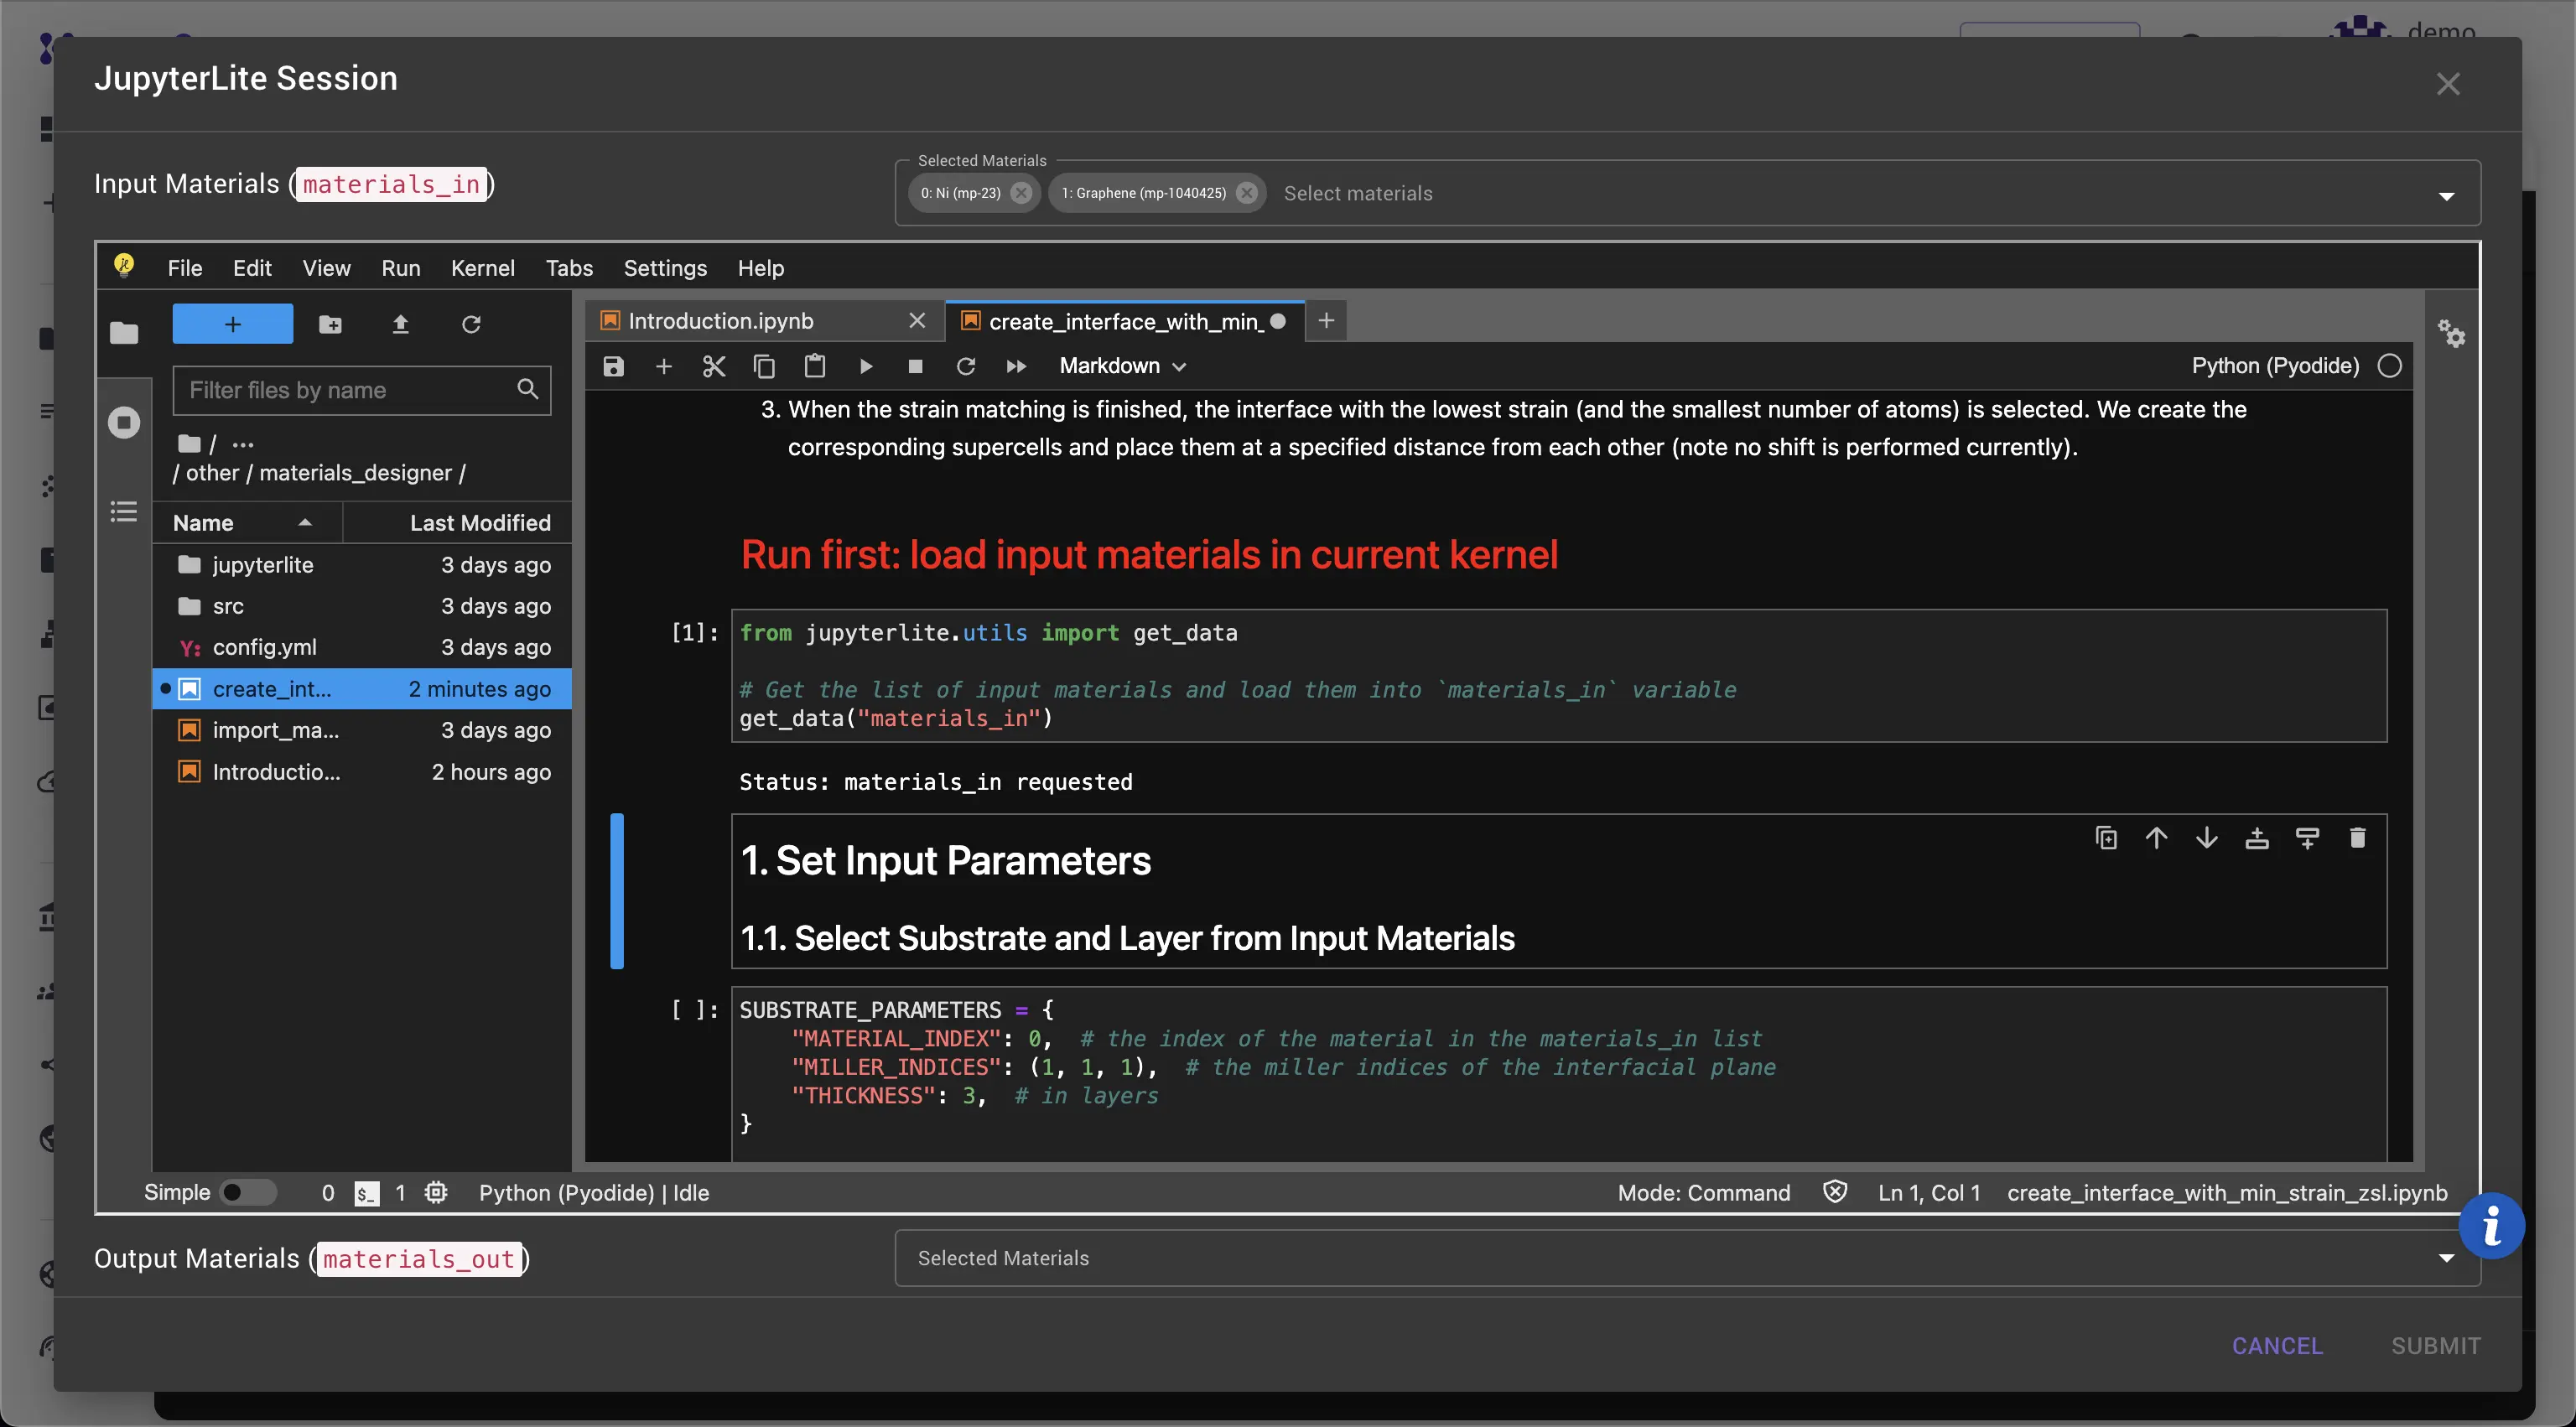
- Set Input Parameters for substrate and layer materials, resulting interface and the algorithm. (In this case, Ni regarded as the substrate and Graphene as the layer. Since unit lattices of Graphene and Ni(111) plane are close, we should reduce the maximum search area for superlattice matching to 100 Angstrom^2 to speed up the search)
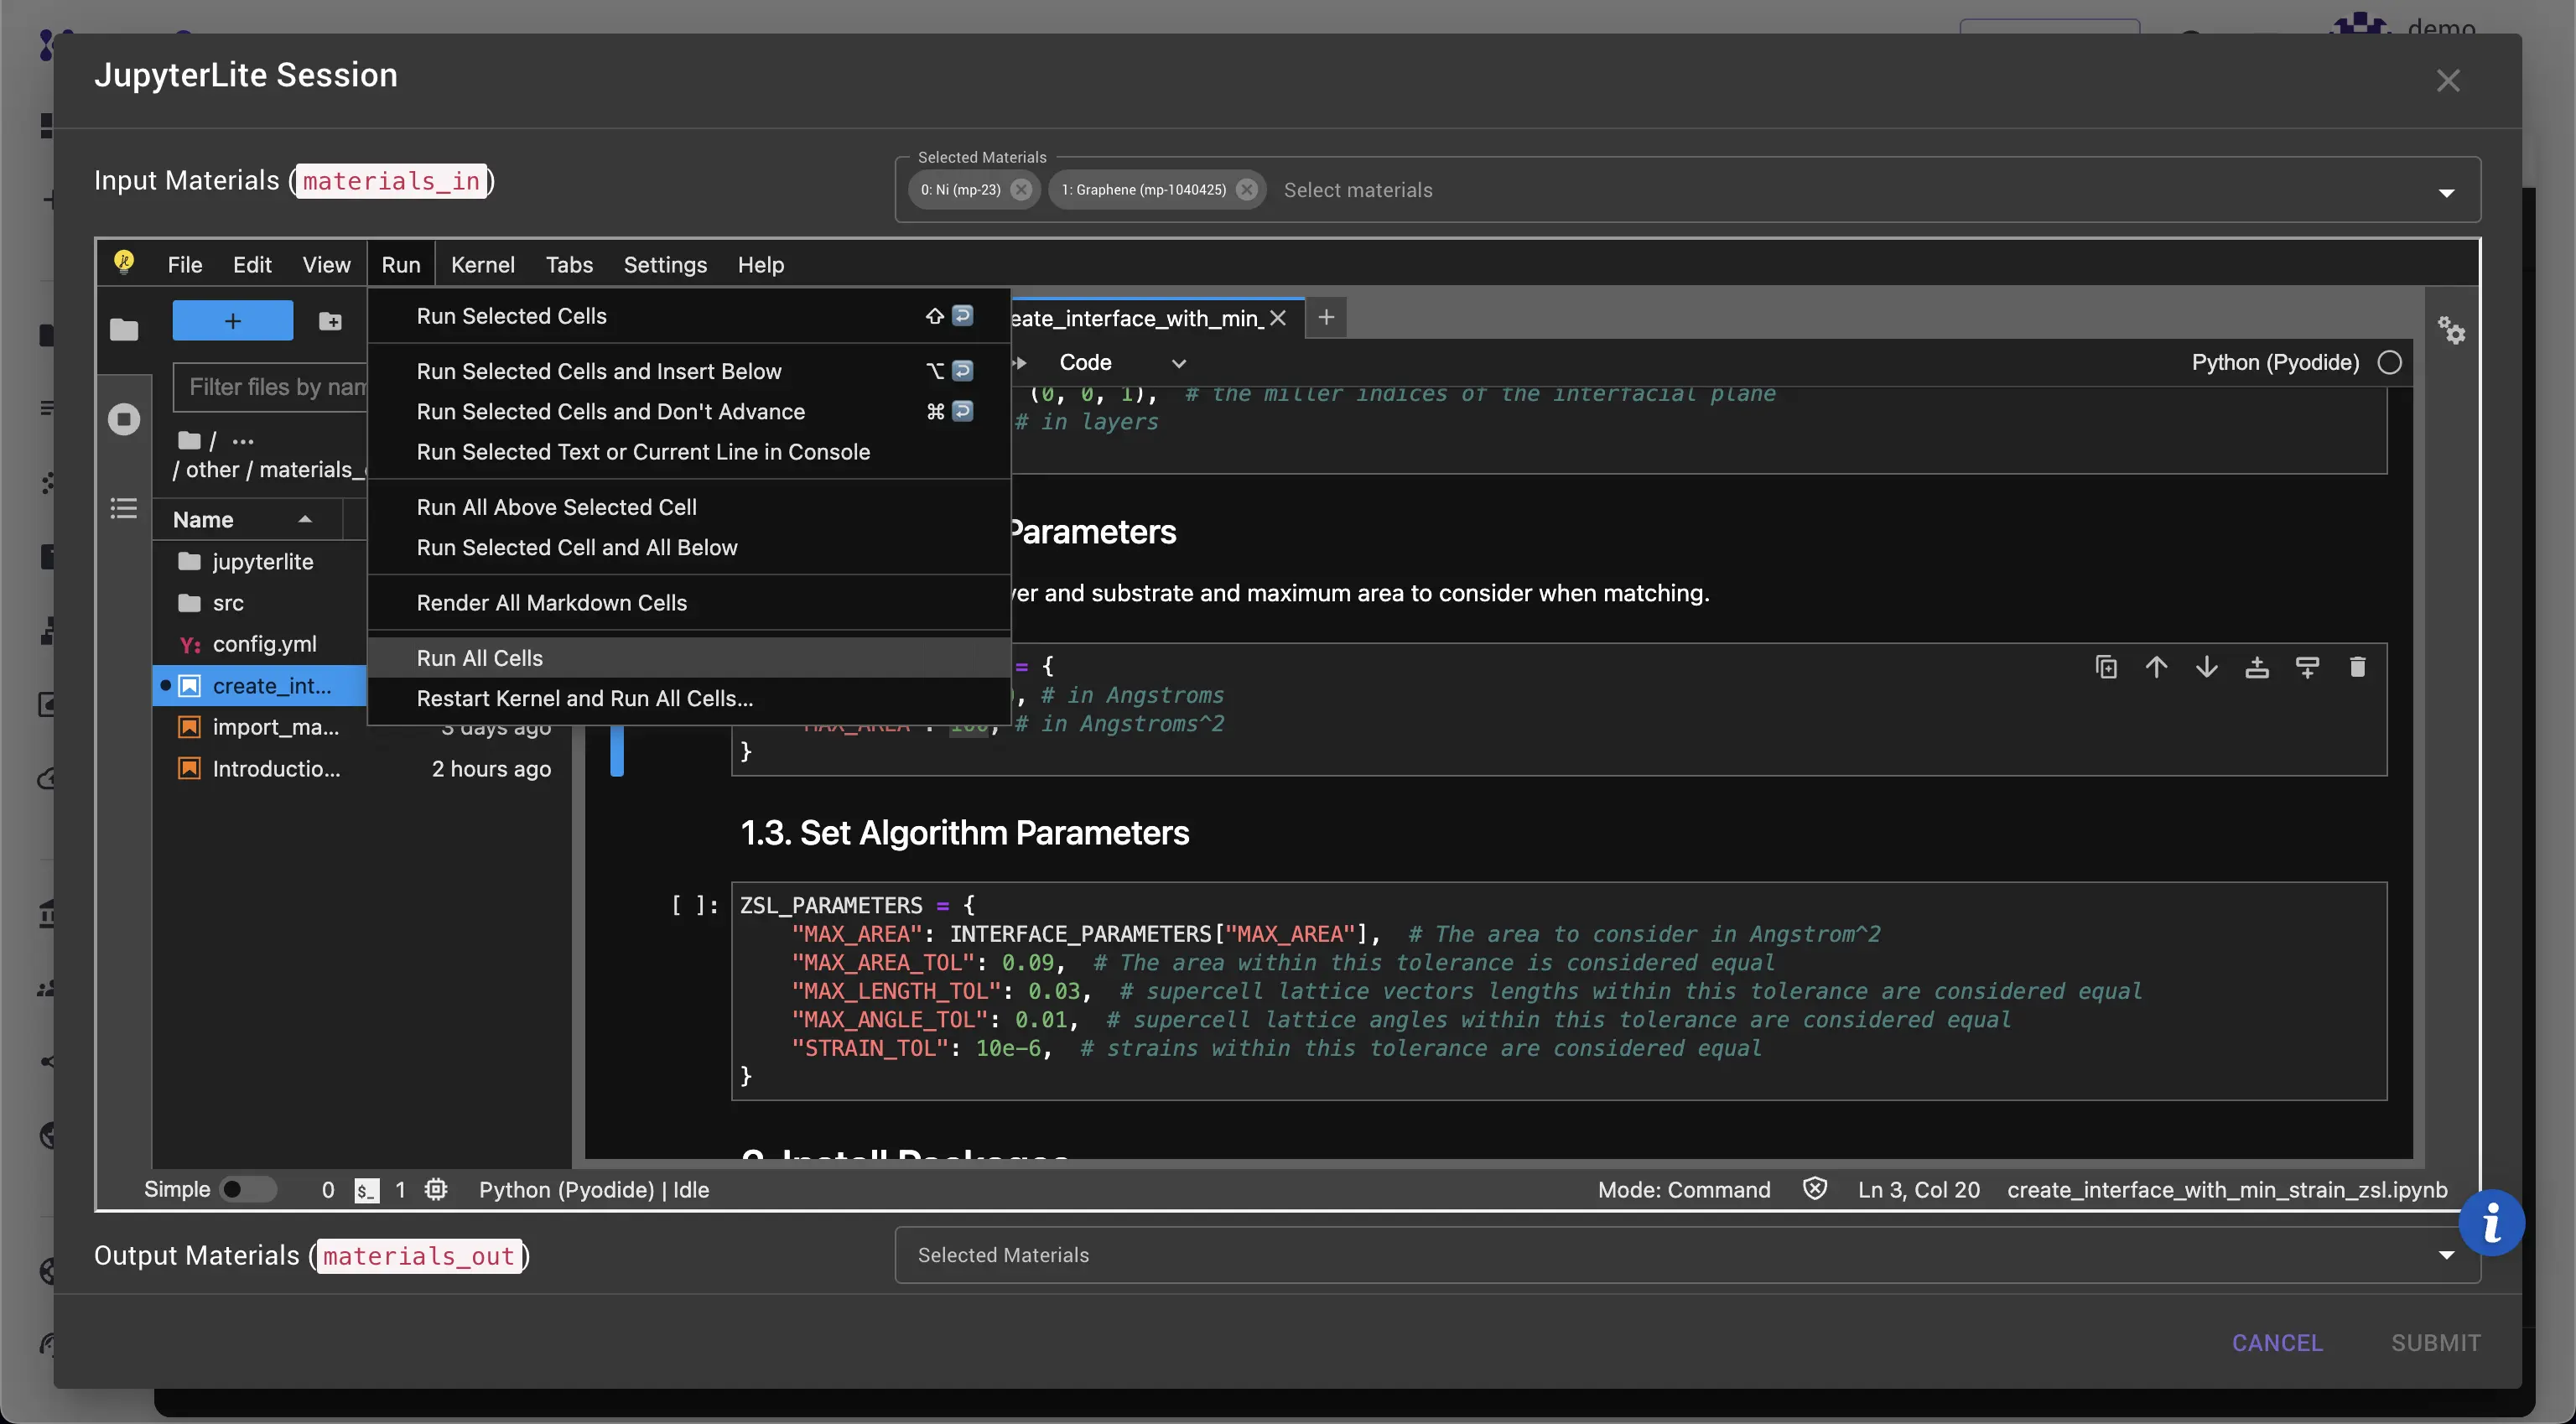
- Click
Run>Run Allto run cells and wait for the results to appear. (Depending on theMAX_AREAparameter, the search may take from seconds to a few minutes to complete.)
Step 4: Analyze the Results
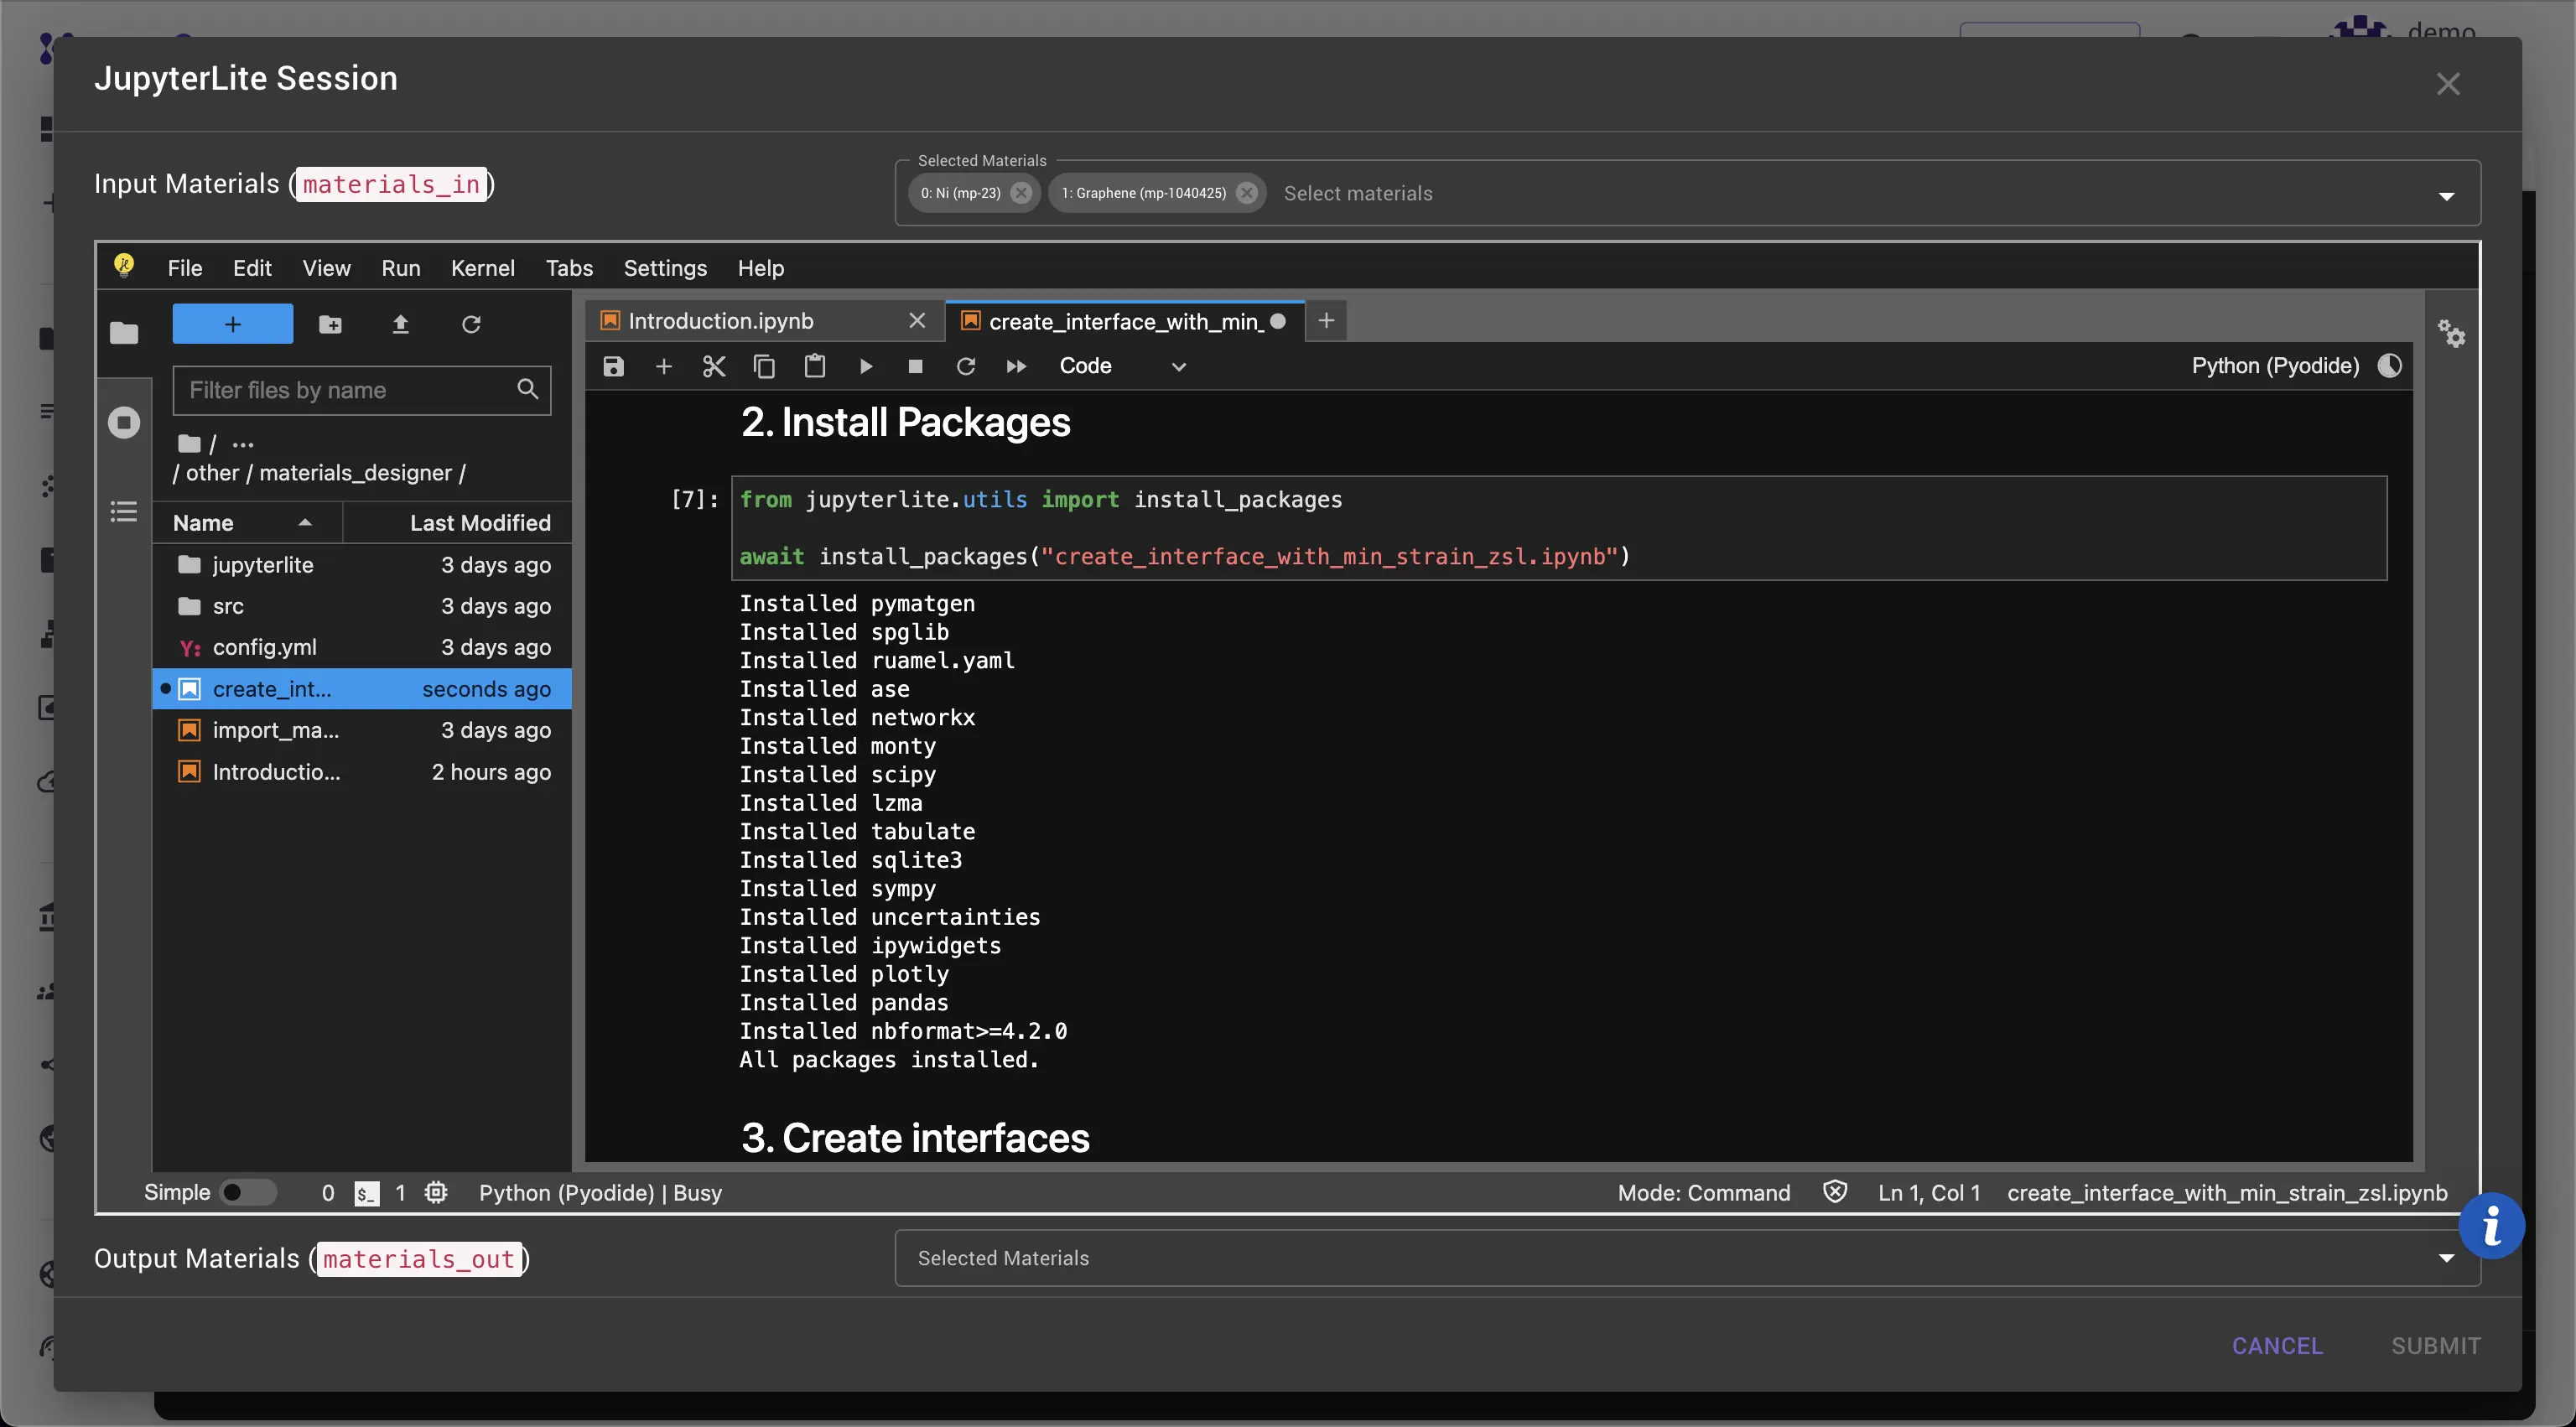
- Output of cell under "2. Install Packages" should display a list of successfully installed packages
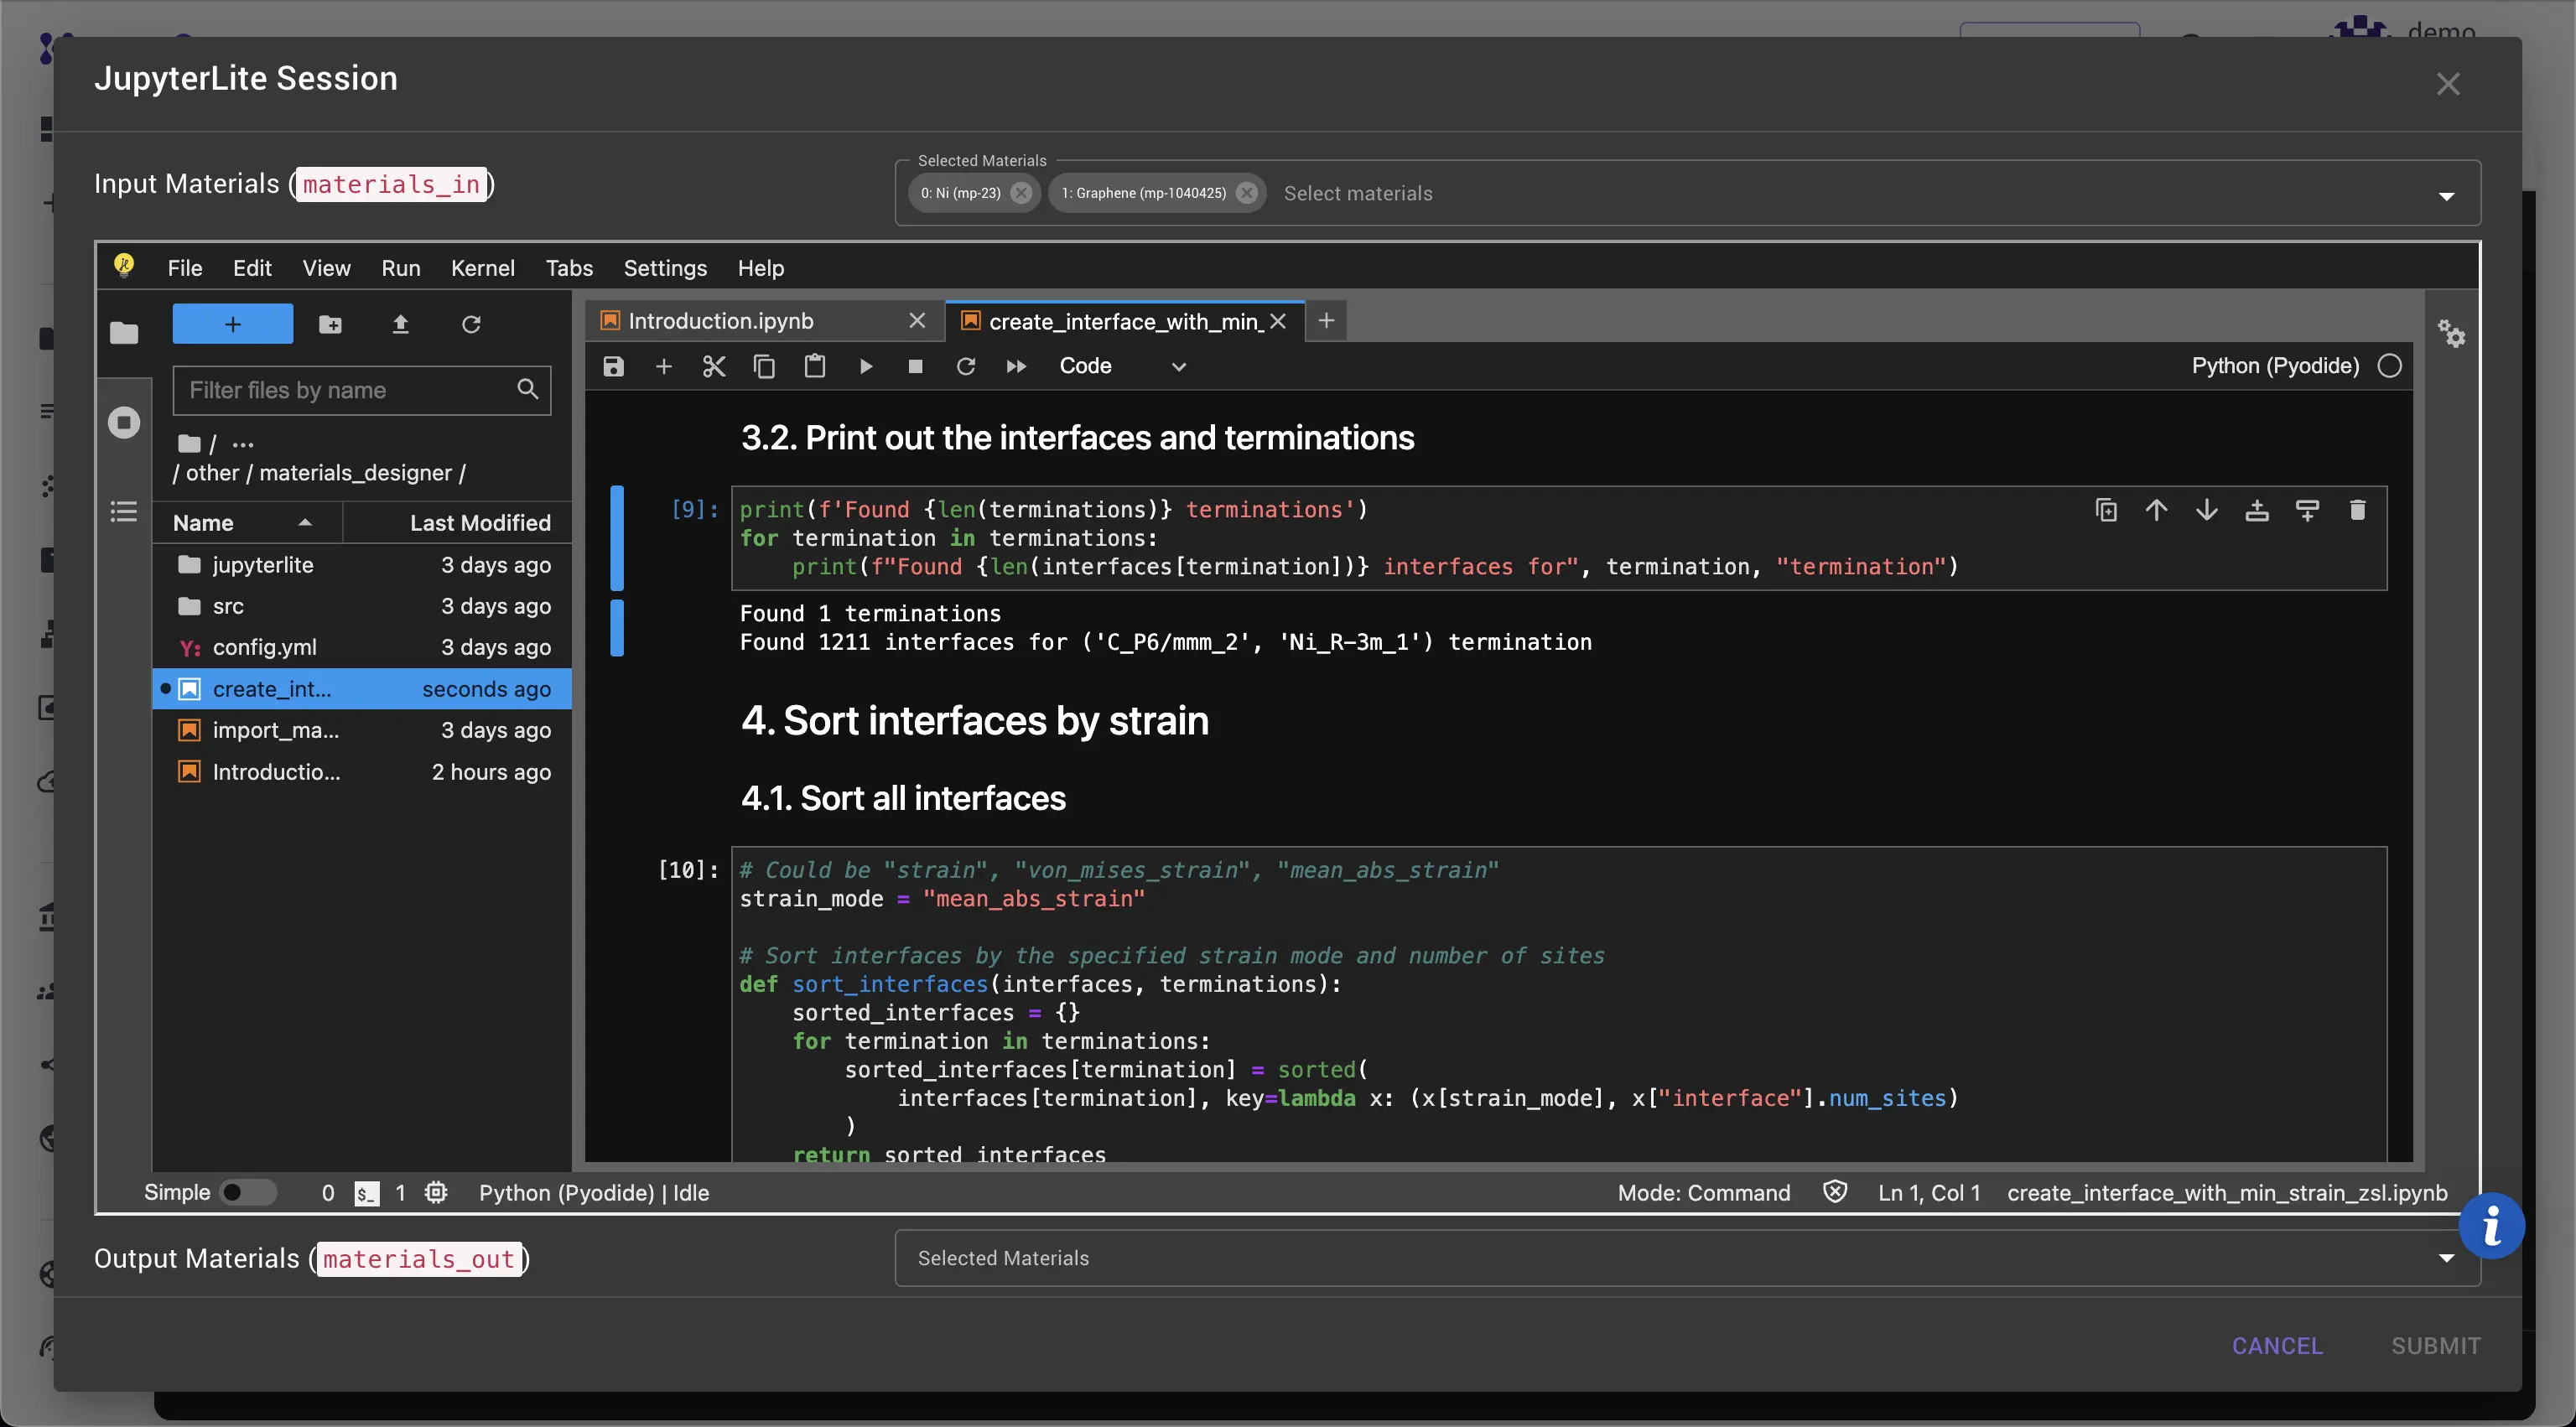
- Output of cell under "3.2. Print out the interfaces and terminations" should display the number of possible terminations (in this case 1) and the number of interfaces for each termination (in this case 1211)
- Output of cell under "4.2. Print out interfaces with the lowest strain for each termination" should display the strain and number of atoms for the interface with the lowest strain for each termination.
- Output of cell under "5. Plot the results" should display a plot of the strain vs number of atoms for each interface. Each point on the plot represents an interface with data for termination, interface index, strain and number of atoms.
Step 5: Select the Interfaces to Return
- Select the termination for the interface by setting variable
termination_indexto respective value (0 by default), and then the number of interfaces with lowest strain to return (by default set to 1). - Verify that Output Materials dropdown contains the selected interface(s).
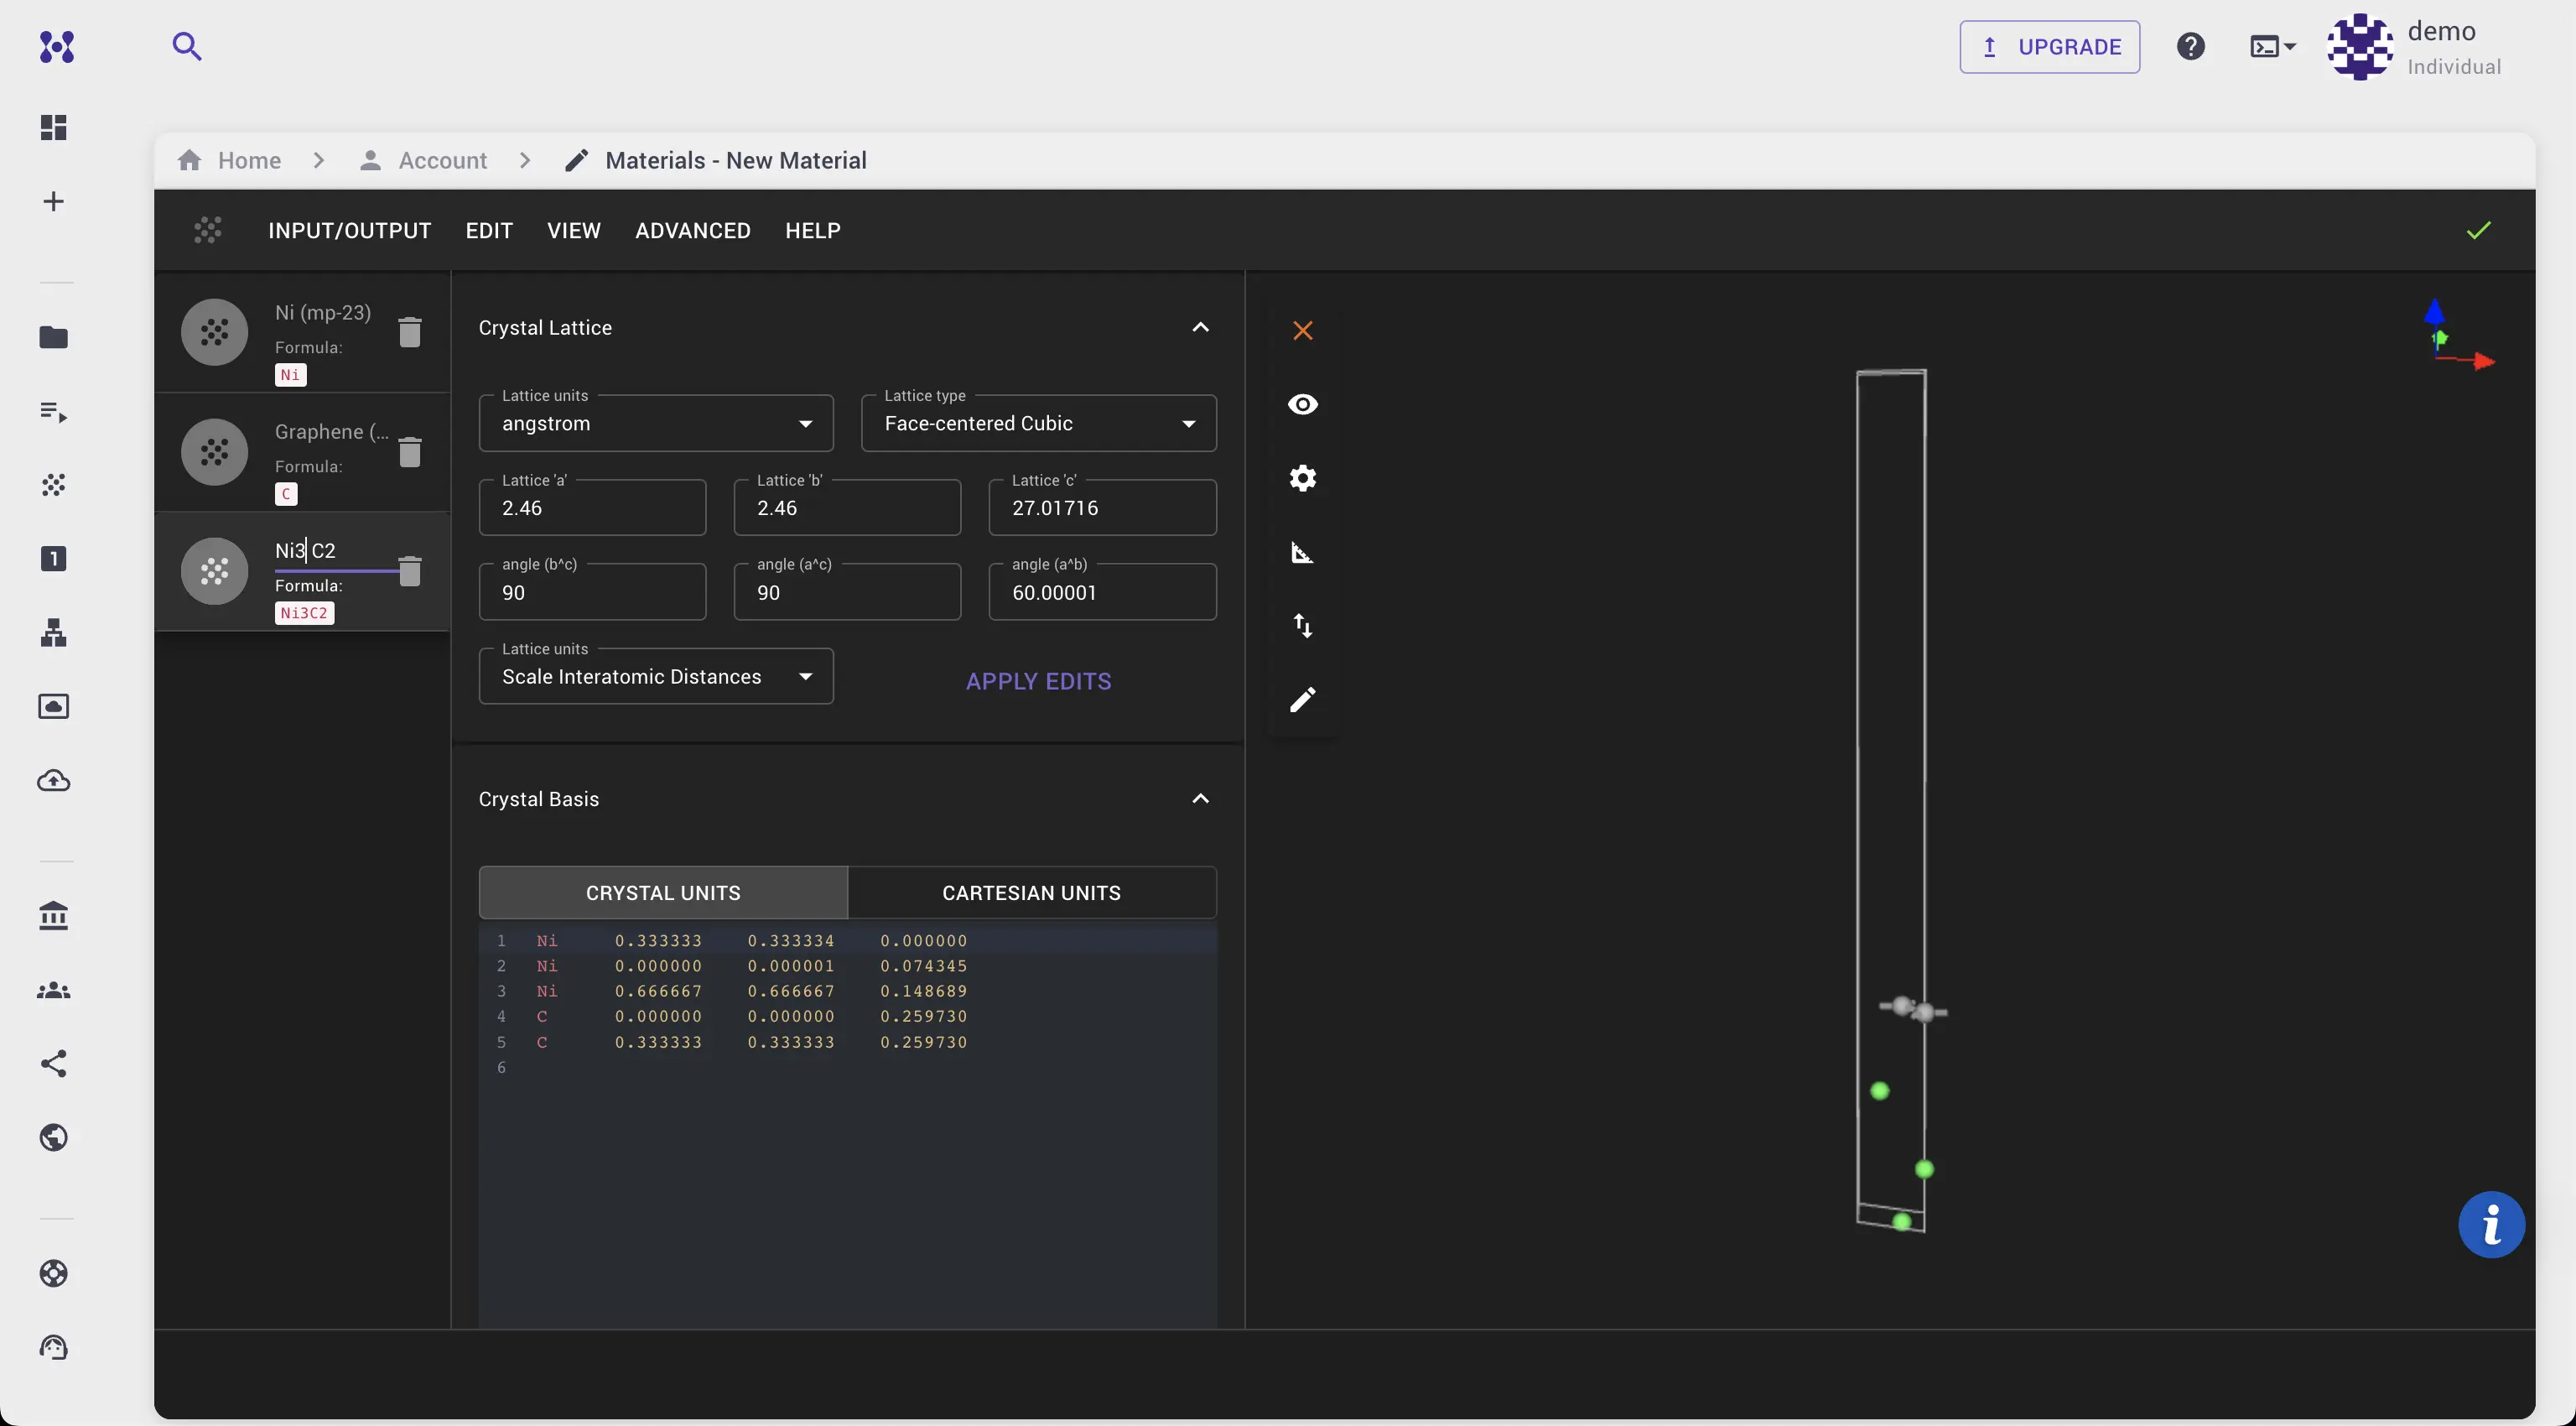
- Click "Submit" to pass materials to the Materials Designer session and take it from there.
- Graphene on Ni(111) interface should now be available in the materials list and can be viewed in the 3D viewer.
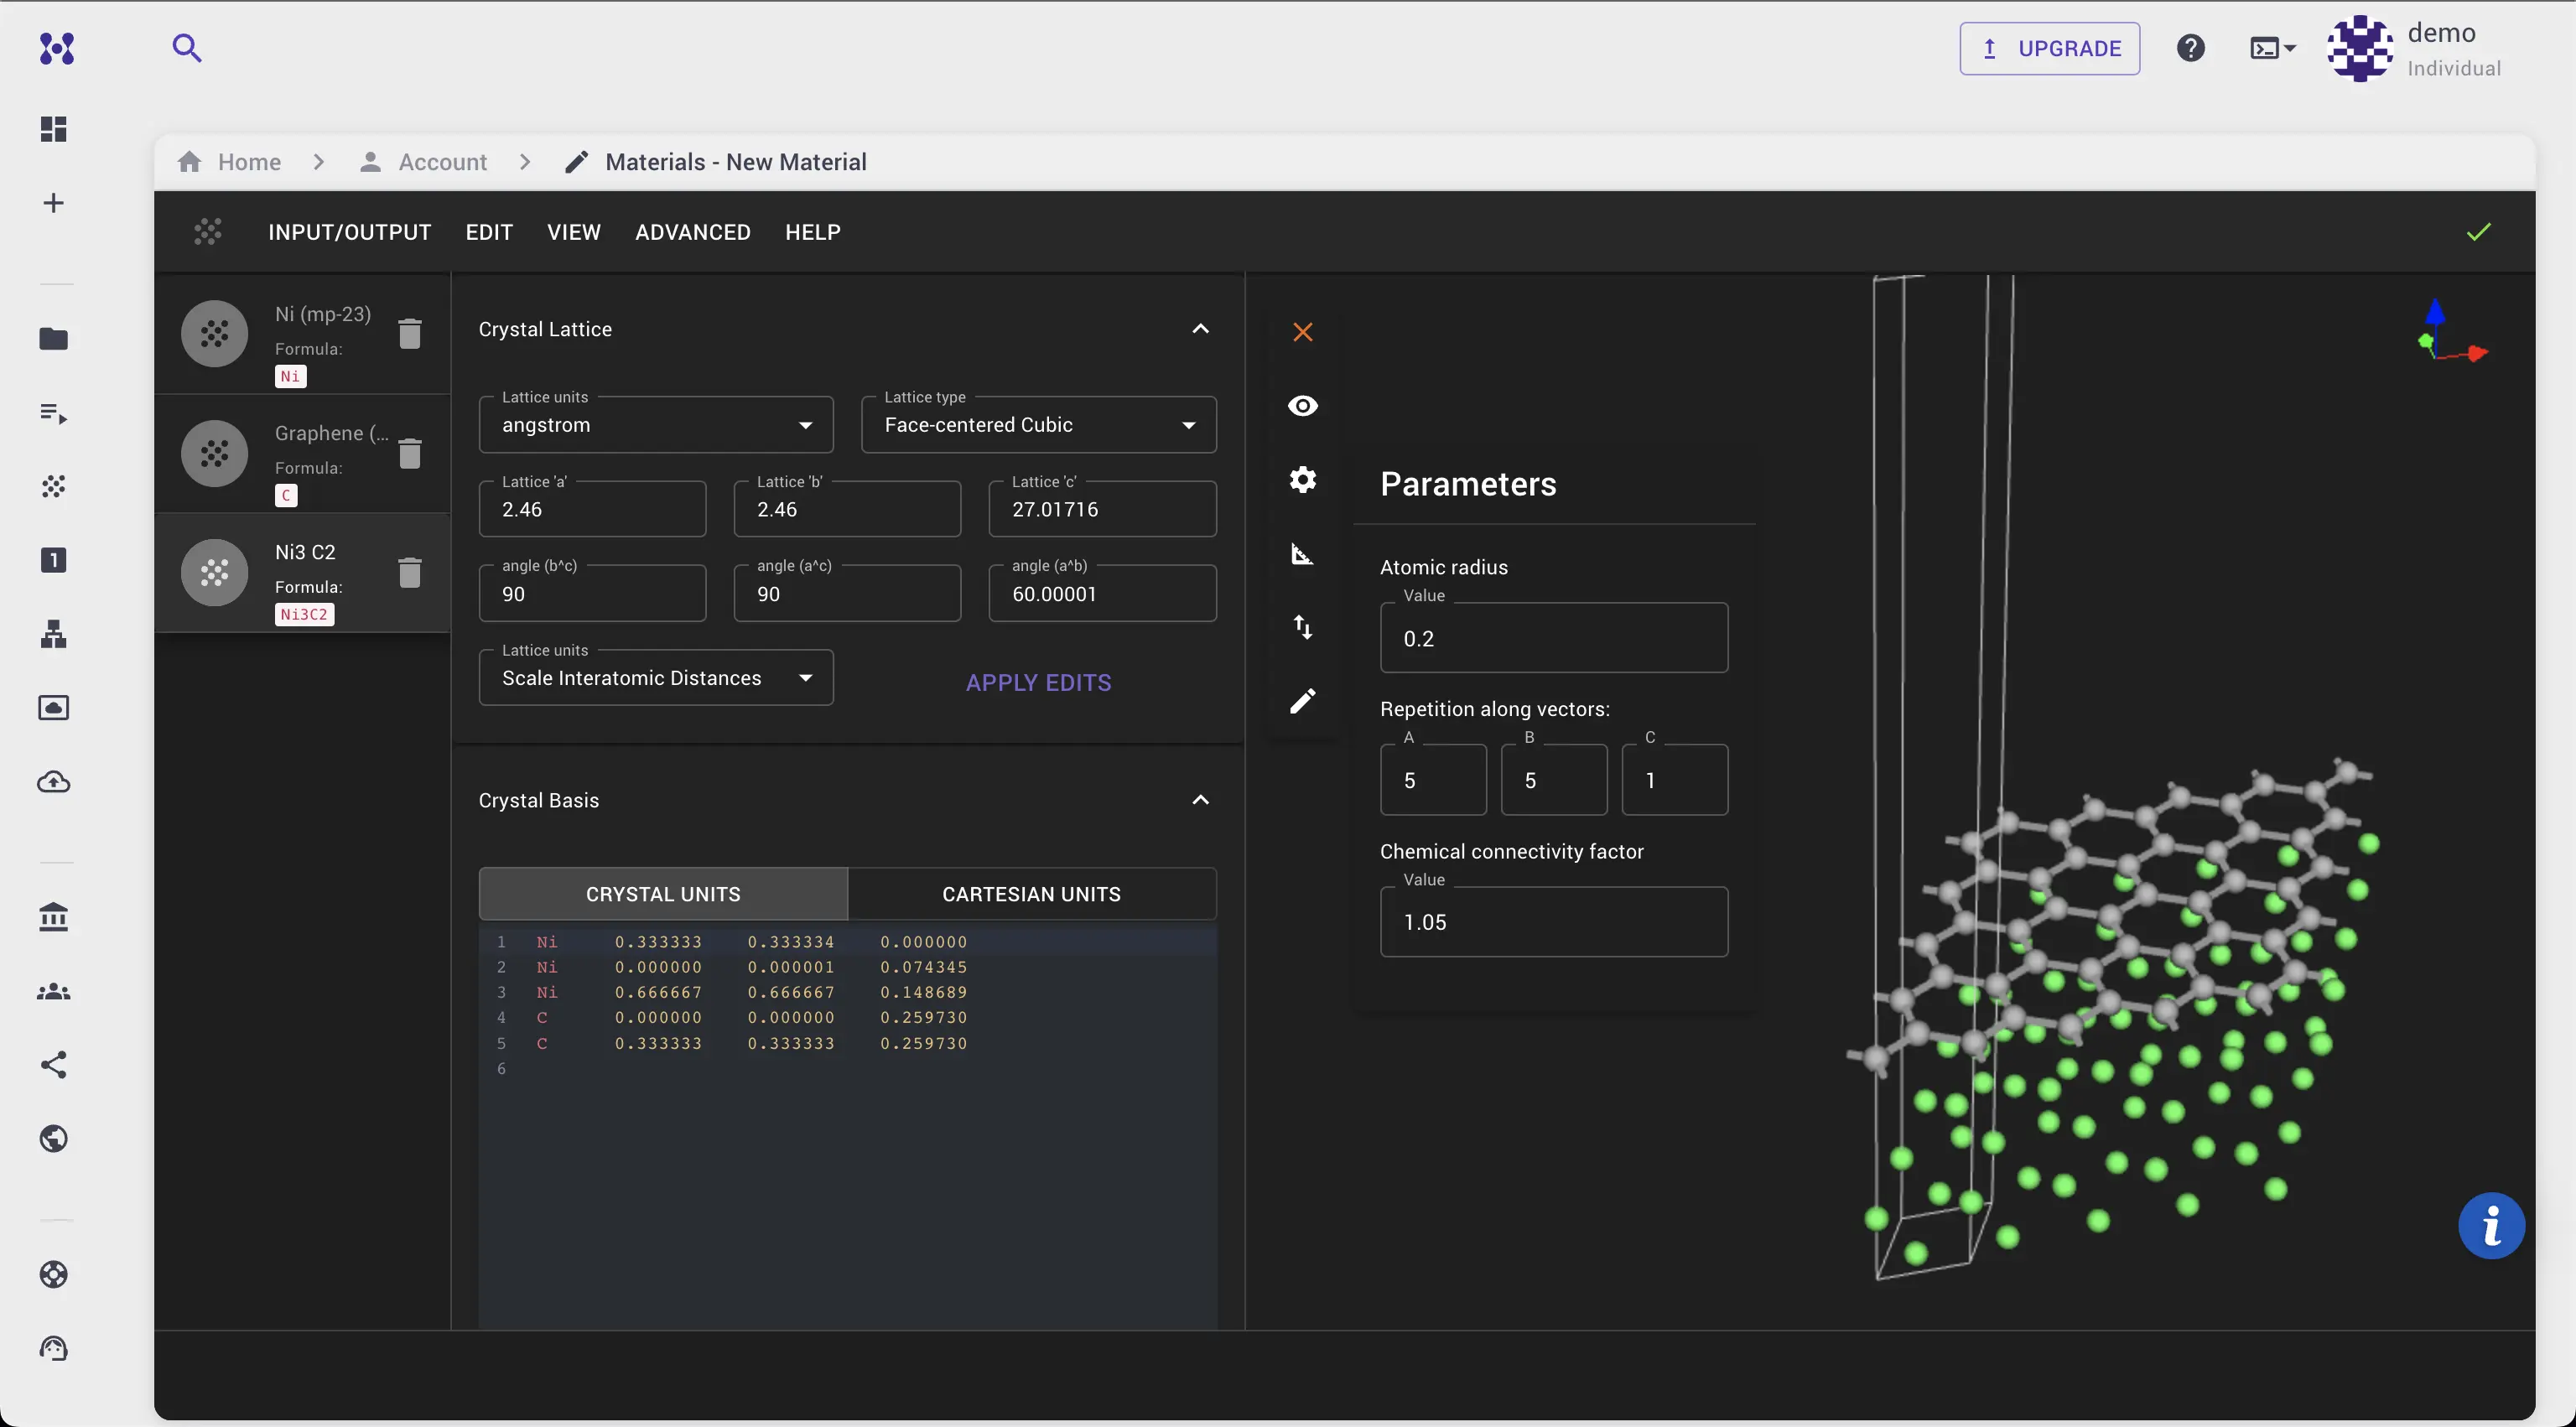
- We can add repetition alongside x and y directions and add bonds to see the result more clearly.
Links
- Zur and McGill Superlattice algorithm paper: (https://doi.org/10.1063/1.333084)
- Zur and McGill Superlattice algorithm implementation by PyMatGen documentation: (https://pymatgen.org/pymatgen.analysis.interfaces.html)